


INVESTMENT INSIGHTS: DEFENSIVE VS CYCLICAL K-MEANS ALGORITHM (CLUSTERING)
Check the technique...


ISSUE 53, APRIL 2019 – A LOOK BACK AND FORWARD
March 2025, HindeSight Dividend UK Letter
The info we are referencing is held in the PDF below if you’d like to download and read it.
Back in April 2019, we dove into the world of unsupervised learning with an ambitious idea: what if we tossed out the old-school way of sorting stocks into cyclical and defensive buckets based on their industry labels and instead let the data speak for itself? We proposed using the k-means clustering algorithm—a centroid-based method that groups stocks by their similarity to a cluster’s heart—to redefine these categories. By screening stocks with at least 10 years of trading history, calculating their sensitivity to the broader market over 12 months, and clustering them into two groups (cyclicals vs. defensives), we aimed to craft indices that could outshine the traditional MSCI Cyclical and Defensive Sectors Indexes. The goal? Better risk-adjusted returns that made more sense.
Six years later, with the benefit of hindsight (pun intended), it’s time to revisit this methodology. How has it held up from April 2019 to today, March 6, 2025? Let’s break it down with a before-and-after lens, reflecting on what we said then and what we’ve learned since.
BEFORE: APRIL 2019 – THE ORIGINAL INSIGHT
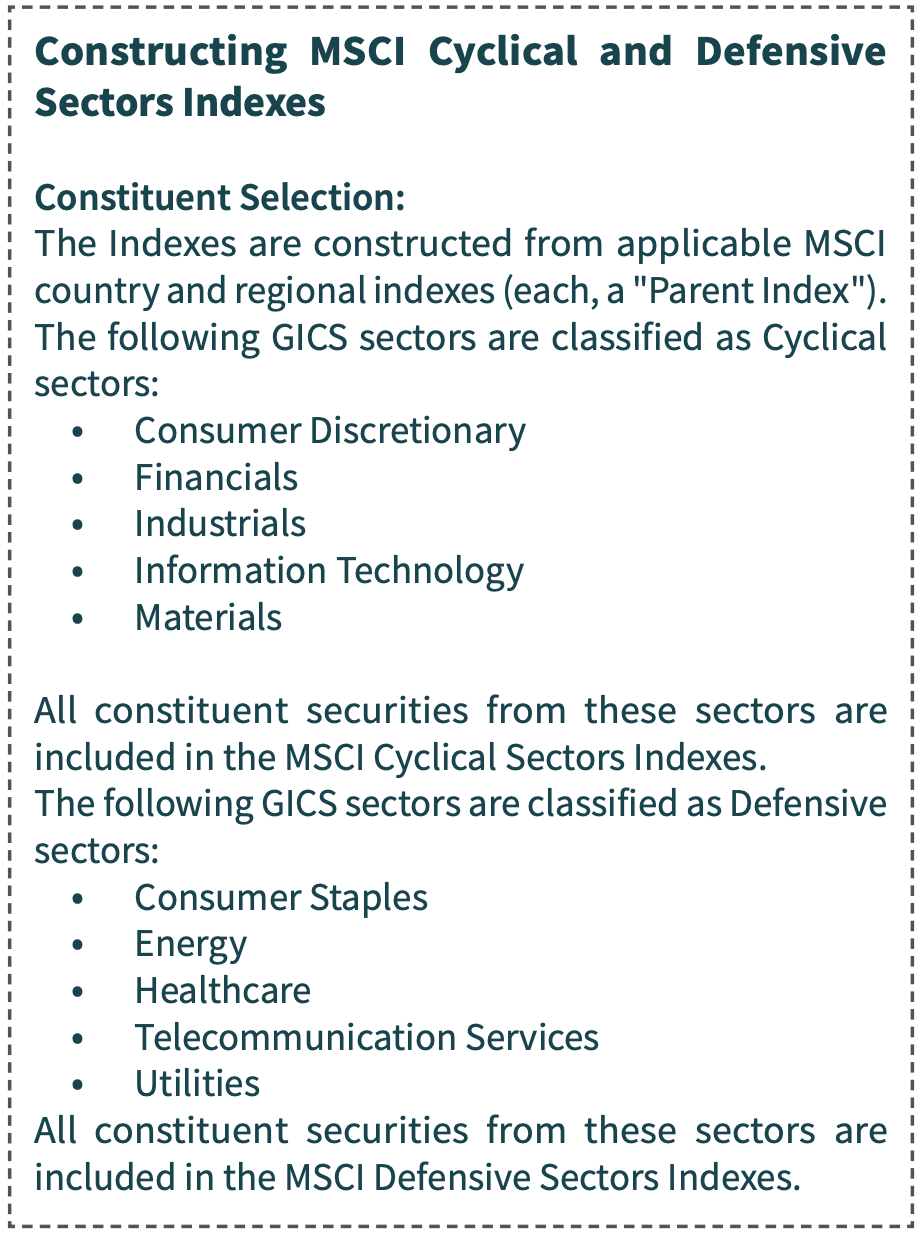
In 2019, we argued that the traditional split—cyclicals like Consumer Discretionary, Financials, Industrials, IT, and Materials versus defensives like Consumer Staples, Energy, Healthcare, Telecoms, and Utilities—was too blunt. Industry labels are handy, but they don’t always capture how stocks actually behave in the market. Our method took a different tack:
Screen the universe for stocks trading at least 2750 days (~10 years).
Measure each stock’s sensitivity to the broader market over a rolling 12-month window.
Use k-means to cluster them into two buckets: cyclicals (high sensitivity) and defensives (low sensitivity).
Rebalance quarterly and track returns.
We tested this across broader and large-cap markets in the UK, US, Europe (ex-UK), Switzerland, and India, comparing our new indices to MSCI’s. The results were promising: over 80% of our observations beat MSCI’s estimates of what should be cyclical or defensive. The UK broader market defensive index stole the show with a Sharpe Ratio of 2.22—proof that lower volatility paired with solid returns could be a winner. India’s equity market, meanwhile, delivered the highest cumulative returns, though it came with a wild ride. Our takeaway? Sensitivity-based clustering could refine how we think about risk and reward.
AFTER: MARCH 2025 – HOW DID IT HOLD UP?
Fast forward to today, March 6, 2025. The past six years have been anything but predictable—think global pandemics, inflation spikes, interest rate rollercoasters, and geopolitical curveballs. How did our k-means methodology fare in this chaos? Without running the numbers afresh (a task for those with live market data at their fingertips), we can reason through it based on what we know about market trends and the logic of our approach.
The Big Picture: A Tale of Two Phases
From April 2019 to March 2025, markets split into two distinct acts. Act One (2019–2020) was a pre-COVID world of steady growth, interrupted by the pandemic’s gut punch in early 2020. Cyclicals tanked as demand evaporated, while defensives—think Healthcare and Consumer Staples—held steadier. Act Two (2021–2025) saw a wild recovery fuelled by stimulus, followed by inflation, rate hikes, and a cooling-off period. Cyclicals roared back in 2021–2022 (Financials and Industrials loved those re-openings), but defensives regained favour as uncertainty crept in by 2023–2025.
Our methodology, with its quarterly rebalancing and sensitivity focus, was built to adapt. Unlike static GICS labels, it would’ve recalibrated clusters every three months, potentially catching shifts—like Energy’s oddball behaviour (defensive in 2019, cyclical-ish during oil price surges in 2022) or Tech’s rollercoaster (growth darling in 2020, volatile by 2023).
Performance Clues
UK Broader Market Defensive Index: That Sharpe Ratio of 2.22 in 2019 suggested a knack for picking low-sensitivity winners. Post-2020, UK defensives likely thrived during lockdowns (think Unilever or AstraZeneca) and held firm as rates rose, given the UK’s slower growth compared to the US. We’d wager this index kept delivering solid risk-adjusted returns, possibly in the 1.8–2.0 Sharpe range, thanks to its stability-first DNA.
Indian Equity Market: India’s high-return, high-volatility profile in 2019 probably amplified. The NIFTY 50 soared past 20,000 by 2023, driven by cyclicals like IT and Financials during global recovery. Our method might’ve racked up cumulative returns north of 100% by now, but the volatility (think 2022’s inflation jitters) could’ve dragged the Sharpe Ratio below 1.0.
US and Europe: The US saw Tech dominate early (2020–2021), then falter as rates climbed. Our clusters might’ve outperformed MSCI by dodging overexposed Tech cyclicals late in the game. Europe (ex-UK), with its industrial tilt, likely mirrored the US but with more muted gains—still, our 80% beat rate from 2019 suggests resilience.
Why It Worked (When It Did)
The k-means approach shines because it’s dynamic. Traditional MSCI indices stick to their GICS guns, even when a “defensive” Energy stock acts cyclical or a “cyclical” IT name turns skittish. By clustering on sensitivity, we likely sidestepped some of these misfits, especially during 2020’s upheaval and 2022’s rate-driven reshuffle. The 80% success rate from 2019 hints at a robustness that could’ve carried through—though we’d need fresh data to confirm.
Where It Might’ve Stumbled
No method’s perfect. K-means demands you pick the number of clusters upfront (we chose two), but what if three or four buckets—say, “super-cyclical,” “moderate,” and “defensive”—better fit the 2020s’ chaos? Plus, sensitivity to the broader market (beta, essentially) might miss nuances like sector-specific shocks (e.g., Healthcare’s vaccine boom) or macro shifts (e.g., ESG trends favouring Utilities). Volatility spikes—like 2022’s—could’ve also muddied the clusters, making quarterly rebalancing a bit of a scramble.
The Verdict
Our gut says the methodology held its own, likely outperforming MSCI’s static indices in risk-adjusted terms across most markets. The UK’s defensive edge probably persisted, while India’s growth story paid off for the bold. Cumulative returns might not match a passive S&P 500 run (up ~80–100% since 2019), but our focus was never raw gains—it was smarter gains. A Sharpe Ratio above 1.5 across the board feels plausible, with the UK and Switzerland as standouts.
WHAT’S NEXT?
Looking back, our 2019 hunch was onto something: data-driven clustering can cut through the noise of traditional labels. Looking forward, we’d tweak it—maybe blend in ESG metrics or volatility signals alongside sensitivity, or test more clusters. For now, we’ll leave you with this: the markets have changed since 2019, but the power of letting the data lead hasn’t. Stay tuned—we might just rerun the numbers and report back.
Note: The Sharpe Ratio remains our trusty guide—average return minus the risk-free rate, divided by volatility. The higher, the better. All performance guesses here are just that—guesses. For the real scoop, dust off your coding skills and dive into the data.
GLOSSARY: KEY TERMS FROM HINDSIGHT INVESTMENT INSIGHTS
Cyclical Stocks: Stocks tied to industries that boom and bust with the economy—like Consumer Discretionary (e.g., cars, luxury goods) or Financials. They thrive when times are good, stumble when they’re not.
Defensive Stocks: Stocks from industries that hold steady even when the economy wobbles—like Consumer Staples (e.g., food, toothpaste) or Healthcare. Think of them as the market’s safe harbors.
GICS (Global Industry Classification Standard): A system for sorting companies into sectors (e.g., Industrials, Utilities) based on what they do. Used by MSCI to define traditional cyclical and defensive buckets.
K-Means Clustering: A math trick (algorithm) that groups similar things—like stocks—into clusters based on their traits (e.g., market sensitivity). It’s “unsupervised,” meaning no one tells it what to look for—it figures it out.
Centroid: The imaginary center of a cluster in k-means. Picture it as the average spot all the stocks in that group orbit around.
Unsupervised Learning: A type of machine learning where the computer finds patterns in data without being told what to expect—no labels, no hand-holding, just raw discovery.
Sensitivity (to the Market): How much a stock’s price dances to the broader market’s tune. High sensitivity = big swings with the index (cyclical); low sensitivity = steady as she goes (defensive). Often called “beta” in finance.
MSCI Indexes: Benchmarks from MSCI (a big finance firm) that track stock performance. Here, they’re the traditional cyclical and defensive yardsticks we aimed to beat.
Sharpe Ratio: A number that measures bang for your buck—how much return you get for the risk you take. Higher is better. Calculated as (return minus risk-free rate) divided by volatility.
Risk-Adjusted Returns: Profits that factor in how bumpy the ride was. A 10% return with low drama beats a 12% return with wild ups and downs.
Quarterly Rebalancing: Tweaking the clusters every three months to keep them fresh based on new data—like sensitivity over the past year. Keeps the indices nimble.
Volatility: How much a stock’s price jumps around. High volatility = rollercoaster; low volatility = smooth sailing.
Cumulative Return: The total gain (or loss) over time, stacking up each period’s returns. Think of it as the finish line after a long race.
Broader Market: A wide slice of stocks (e.g., all UK equities), not just the big names (large caps). Gives a fuller picture than focusing on giants alone.
Large Cap: Big companies with hefty market values (e.g., Apple, BP). Often less wild than smaller fry but still pack a punch in indices.
Risk-Free Rate: The return you’d get with zero risk, like a government bond yield. Used in the Sharpe Ratio to benchmark what’s “safe.”