


INVESTMENT INSIGHTS
Checking in on our historical lessons.

With over a decade of our newsletter to call on, we’re looking at what lessons we can learn from the past. A big part of investing we’d argue is historical, partnered with learning lessons. Have a read and see what you think - the initial article was from September 2017 - the assessment for today is towards the end so if already familiar with what was happening, skip to the end.
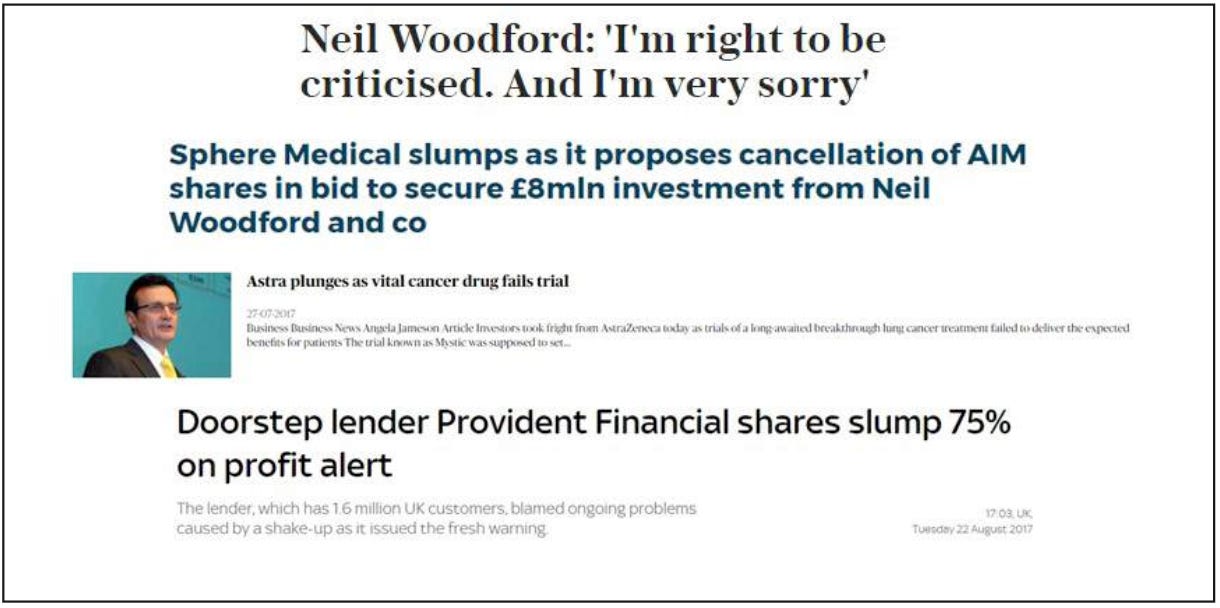
Headlines like these have become far too regular of late. In fact, when we ran some statistics for how many companies’ share prices in the FTSE 350 had seen more than 15% declines from their early 2017 highs and are still down, 180 companies were below the red line. That’s over 50% of the index, with some of them down 80%. No wonder even the legendary Neil Woodford’s fund is falling fast.
However, all the actual indices, the FTSE 100, FTSE 250 and FTSE 350 are up, 3.2%, 8.6% and 4.1% respectively. Clearly, there must be some companies doing very well. Regular readers will know that I believe stock valuations are very overpriced currently, but before we argue that this is just a case of the half-full, half-empty glass, we should understand that the observation is just typically what the technical analysts of the stock markets call ‘breadth’. Breadth can be measured in many ways, but the eventual analysis should focus on whether the ratio of stocks going up, versus down, signals a potential strong or weak market in the future. Declining breadth, where the number of companies making new highs versus lows, is usually a sign of wider spread weakness ahead.
We know that in the UK stock indices, just like the SP500 in the US, there are some huge companies potentially ‘holding’ up the index, which is not a particularly good sign, especially if these companies are not seeing strong earnings. In the UK, for example, the huge size of Unilever, at almost 5% weighting of the index, means that the stellar 40% stock price rise this year is responsible alone for an index move of 2%, over half the actual 3.2% year to date rise in the FTSE 100. In the US, we have the well-known FANGs stocks – Facebook, Amazon, Netflix and Google ¬– almost dictating daily SP500 movements with their high market capitalisation weightings.
Neither a huge difference in returns across companies in the preceding periods, nor a small number of very large companies driving the index returns, is a great sign of a stable and strong market.

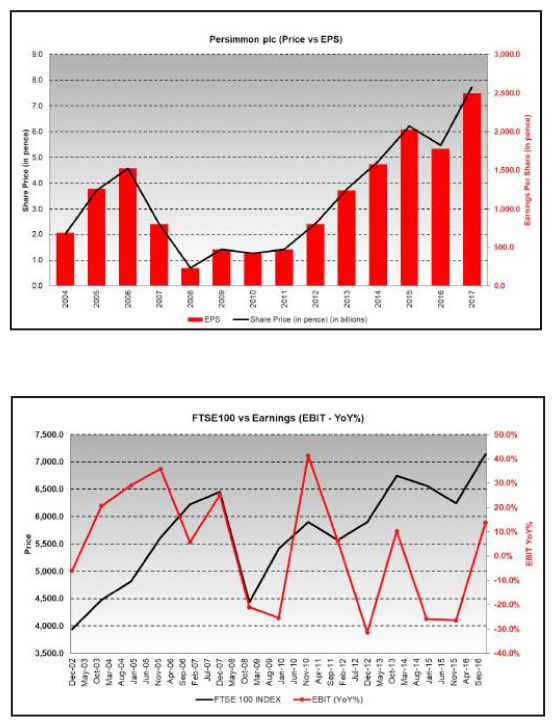
However, much more important are the stock price increases or decreases in these companies that relate to an increase or decrease in actual earnings, or are much more to do with the expansion or contraction of the price/ earnings multiple itself. Unfortunately, it would appear that far too many of the price advances of rising stocks in the last few years are multiple expansion, rather than earnings growth. Persimmon is one of the few winners this year that demonstrates a ‘good’ story. It is up over 40% this year, but its P/E ratio still only trades around 11 because its earnings per share keep rising.
One of the outcomes we shouldn’t want is for all companies with declining stock prices to have earnings that are also declining with still relatively high price/earnings ratios and most companies with increasing stock prices to have negligible earnings growth with very high price/earnings ratios. Again, that appears to be where we are today.
Unilever, the stand out big cap performer of 2017, has earnings per share just back to the 2013-2050 period, but with a P/E of 24.6. For a company Unilever’s size, the earnings growth they ought to see to justify such a high P/E is very hopeful indeed.
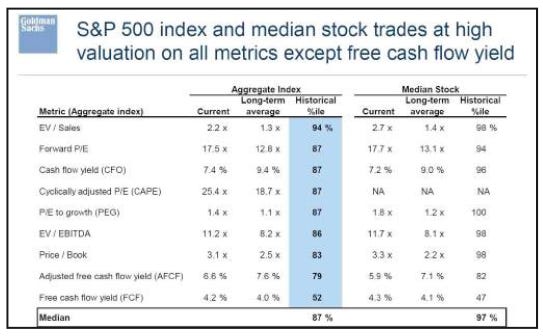
A recent research piece by Goldman Sachs showed that the typical SP500 index stock trades in the US at the 98th percentile and the overall index at the 87th percentile relative to the last 40 years.
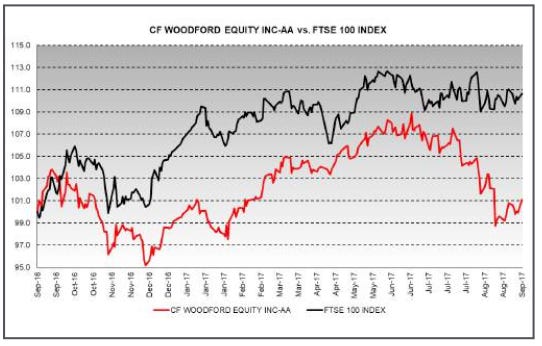
The advocates of Exchange Traded Funds for equity indices – passive investing, as it is often known ¬¬– are enjoying their moment in the sun. Even the super hurricane season in the US is unable to touch the bulletproof main stock market index. A recent comparison against Neil Woodford’s active stock-picking is there for all to see, but the smug cheering may be short-lived.
With extreme valuations, dropping breadth is often compared to kicking table supports away, leg by leg. Eventually, gravity wins out.
History Lessons
The article captures a moment of uncertainty and structural instability in global and UK stock markets, particularly highlighted by the underperformance of smaller companies and the over reliance on a handful of major players to prop up indices. Its key insights include:
Market Breadth as a Warning Sign: The declining breadth (the ratio of advancing to declining stocks) is a significant indicator of underlying market weakness, despite the indices' headline growth. This disconnect between broad market performance and indices driven by a few large-cap stocks remains a relevant concern for long-term market health.
Overreliance on Major Stocks: The dominance of "superstar" stocks such as the FANGs in the US or Unilever in the UK demonstrates how indices can mask widespread declines. This points to a concentration risk, which makes the market vulnerable to corrections if these leaders falter.
The Role of Valuations: The focus on price/earnings (P/E) ratios highlights the potential danger of overvalued stocks driven by multiple expansions (investors paying more for the same earnings) rather than earnings growth. This imbalance suggests unsustainable market conditions.
Passive vs. Active Investing: The comparison between passive ETFs and Neil Woodford’s active strategies underscores the tension between these approaches. The text foreshadows the potential shortcomings of extreme reliance on passive strategies in times of market turmoil.
The 2017 piece rightly identifies several red flags, particularly the risks of overvaluation and narrowing market participation. These insights remain vital as investors consider long-term strategies.
Why the Insights Matter Today
Fast forward to 2025, and the lessons of 2017 resonate deeply. The subsequent collapse of Neil Woodford's fund, partly due to overexposure to illiquid small-cap stocks, became a cautionary tale for active management. Meanwhile, passive investing surged in popularity, driven by lower fees and simplicity. However, the structural risks identified in 2017 have persisted, with some new twists:
Continued Concentration Risk: The dominance of "mega-cap" tech stocks has intensified. Companies like Apple, Microsoft, and Nvidia now account for even larger portions of indices like the S&P 500. This has created a precarious situation where a small group of companies dictates market movements, echoing concerns about Unilever and the FANGs in 2017.
Valuation Disparities: While the markets saw significant corrections in 2022, many stocks remain priced at historically high multiples. The ongoing reliance on multiple expansions over earnings growth means markets are still vulnerable to interest rate changes and economic slowdowns.
Market Breadth Revisited: Recent bull runs have seen uneven participation, with large-cap stocks outperforming while smaller companies and certain sectors struggle. This declining breadth mirrors the conditions described in 2017, hinting at potential instability.
Passive Investing Dominance: The rise of passive investing, now controlling a substantial portion of the market, has magnified systemic risks. Passive strategies tend to buy stocks indiscriminately based on index weighting, potentially exacerbating overvaluation in the largest companies.
Lessons Learned:
Diversification Matters: Over concentration in a few stocks or sectors creates systemic risks, making it crucial for investors to ensure true diversification across asset classes and regions.
Valuation Discipline: The dangers of ignoring fundamentals—such as earnings growth and reasonable P/E ratios—have been repeatedly underscored. Valuation bubbles, as seen in both growth stocks and speculative assets like cryptocurrencies, eventually burst.
Active vs. Passive: While passive investing remains an effective strategy for many, active managers with sound judgment and robust strategies can identify opportunities and navigate risks more dynamically. However, transparency, liquidity management, and alignment with investor goals are essential to avoid high-profile failures like Woodford’s.
Market Signals Matter: Paying attention to indicators like market breadth, as highlighted in 2017, is key to identifying structural weaknesses beneath bullish headlines.
The tale of Sphere Medical's slump and the broader market dynamics of 2017 serve as a reminder that beneath the surface of indices, individual companies and the broader economic environment remain the true drivers of long-term success. Today's investors should heed these lessons as markets continue to evolve under new pressures and opportunities.
Happy Investing!