


HindeSight Letters Investment Insights Archive - READ HERE

Our FREE archive posts allow our subscribers to access valuable insights and analysis and a deeper understanding of market trends and investment strategies that were relevant at the time the HindeSight newsletter was published.
Additionally, reading archived newsletter content can give you a sense of the long term performance of the investments or strategies discussed which can be helpful in making informed investment decisions.
Furthermore reading this content can provide historical context and help you see how market conditions have changed over time, allowing you to better anticipate future developments.
Overall reading our archived content can be a useful tool for gaining a broader perspective on the market.
LIMITED OFFER. GET A 90 DAY FREE TRIAL OF OUR PREMIUM SUBSCRIPTION & MAXIMISE YOUR INVESTMENT POTENTIAL
INVESTMENT INSIGHTS
Originally posted in January 2019

‘All the shipwrecks at the bottom of the ocean have charts on them’ is an old saying, which is o!en attributed to the legendary value investor Warren Buffett.
Most people are familiar with price charts of stock markets, individual stocks, commodity markets and other asset classes. Typically, they are simple line charts that give basic information over some historic period. As you can see in the example below, the FTSE 100 index had a high in 2018 of 7900 and closed the year at 6750. But do historic price charts give us any information that we can use to extrapolate the future movement of prices and profit. It is all very well for economists to write all-knowingly about the past and how we got to this current price in time, but traders and investment managers have to envisage the future.

Technical traders, as they are known, are traders who pore over charts and rely almost exclusively on them in the hope that these profits will be forthcoming. In some ways, it seems reminiscent of shipwreck hunters or oldworld pirates.
In my mind, there is no doubt that charts and technical indicators are a very important tool in analysing markets, most especially when it comes to a timing decision. A general understanding of the current valuation in the asset class, coupled with an excellent chart analysis, is often enough to produce a profitable investment.
There are many different chart types, with multiple indicators and tools that are related to them, and all traders have their own preferences. My personal all-time favourite is the Japanese candlestick charts, but as I started my city career at the Japanese brokerage house, Daiwa Europe in 1983, I may be prone to bias.
The widely accepted history of candlestick charts is they were developed in the 1700s in Japan by a rice trader, Munehisa Homma, a few centuries before the observation of bar charts and point and figure charts in the West. With rice being the staple part of the Asian diet, the importance of an active futures market place for it must be seen in the same light as the development of the grain futures exchanges in Chicago 150 years later. The ability of farmers and producers to offset their risk with buyers for future delivery was seen as a huge leap in the efficiency of feeding the growing populations.
In 1985, Daiwa Europe Ltd was located at St Paul’s churchyard in the shadow of the great edifice itself. My first proper ‘trading’ job was to work next to the US Treasury trader, Takashi Hibino. Clearly, his talents were significantly above teaching young traders as he has been CEO of the Daiwa Securities globally since 2011. Somewhere, in the depths of my attic, I’m sure someone will one day find four yellowed parchment papers of maybe 40 candlestick ‘patterns’ on them, with the Japanese script above them and my scribbled translation underneath, courtesy of Hibino-san. It certainly held me in good stead back then and throughout my trading career, so thank you, sir.
The link between price and the supply and demand of rice in the 18th century is just as relevant today in the financial markets. Markets are made up of producers, intermediaries and end-users with price the determining factor in many decisions, and strongly influenced by the emotions of all. I have found ‘candlestick pattern’ charts to visually represent that emotion far better than simple bar or line charts. Traders used to draw these charts themselves with the simple instructions, as below. A horizontal line for the open and the close, and a wick above and below to show the high and low, with alternate colours, depending on whether it was an up or down day.

Fortunately, new students of the markets don’t have to get translations done to get to grips with all the secrets of candlestick charts. Google comes to the rescue immediately and the original books by Steve Nison are still as relevant today.
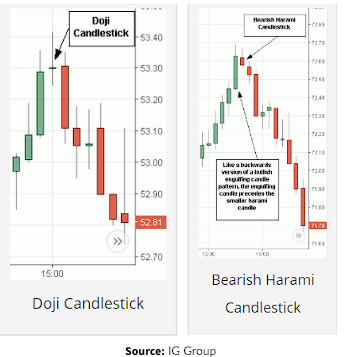
Patterns bearing the wonderful Japanese names like ‘Doijs’ and ‘Haramis’ spring to life, in either two or three-day patterns, as below, coupled with ominous sounding ‘Hanging Man’ and ‘Evening Star’ patterns.
Astute observations of these candlestick patterns have assisted me in over 30 years of trading, not just in making actual profits, but also in preventing losses. Crucially, they also help you to stay current with the market and understand what the candlesticks are telling you about other people’s positions and preference for exchange at any price. While all patterns have relevance, I have found the three-day patterns stronger and longer term in terms of trend ending. Investors who are ignorant or ignore these patterns do so at their peril and loss.
Our current stock pick this month is Galliford Try, which you can see in the chart below. It had a long downtrend from 1100 as recently as September that ended in my opinion with the clear ‘morning star doji’ in early December. Although we recommended the stock a few weeks later, as our other indicators were screaming buy, the ‘last seller’ may well have been seen on doji day.
I would advise everyone to spend more time poring over candlestick charts as they will help you to find that buried treasury!
WHY CHOOSE US?
HindeSight Letters is a unique blend of financial market professionals – investment managers, analysts and a financial editorial team of notable pedigree giving you insights that never usually make it off the trading floor.
We help our paid subscribers have 100% control to build their own portfolios with knowledge that lasts a lifetime and all for the price of a good coffee a month - just £4.99 or save 2 months by subscribing to our yearly plan, only £49.99.
Our history is there for all to see, measure and research.
LIMITED OFFER. GET A 90 DAY FREE TRIAL OF OUR PREMIUM SUBSCRIPTION & MAXIMISE YOUR INVESTMENT POTENTIAL
Visit hindesightletters.com for more information