


How Have We Done?
Let's Assess To Date

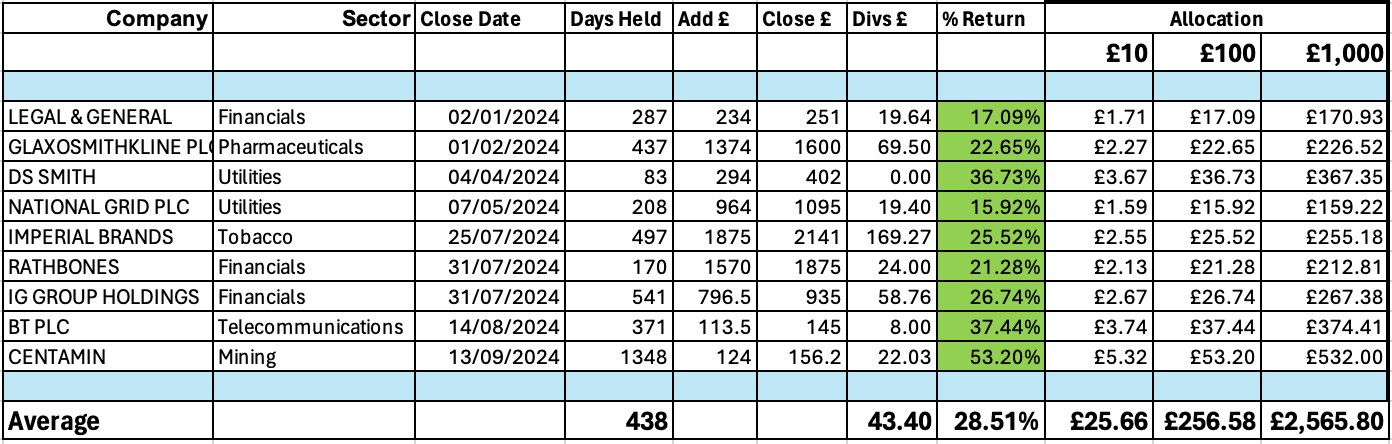
The table lists nine of HindeSight’s Portfolio #1 Add Alerts across various sectors, with an average return of 28.51% over an average holding period of 438 days (roughly 1.2 years). The returns range from 15.92% (National Grid PLC) to 53.20% (Centamin), with an average closing value of £43.40. The portfolio includes a mix of sectors: Financial, Pharmaceuticals, Utilities, Tobacco, Telecommunications, and Mining. For a £1,000 investment, the average return would be £2,565.80, which we believe is a strong performance over this timeframe.
In total, at present as of April 2025, we’re at 30+ positive close alerts, to be balanced, we also have a basket of 8 shares in negative territory on paper (though less so when dividends are added in) and another four that are in positive territory nestling in our active Portfolio #1so we’re just talking about the shares above to begin with and will assess the rest soon.

Benchmarking performance for Comparison
We thought it might be interesting to benchmark our performance against others. We have always been 100% transparent about our portfolio and what, when and how we add and close is in our alerts that we ask customers to pay just £4.99 a month for - so this is an opportunity to see if they’re getting value for money. In assessing how HindeSight’s Portfolio #1 performs, we can compare it to:
Morningstar Ratings and Recommendations: Morningstar provides star ratings (1 to 5 stars) based on past performance and risk-adjusted returns, as well as forward-looking Medalist Ratings (Gold, Silver, Bronze, etc.) based on qualitative analysis of a fund’s people, process, and parent company. They also track fund and ETF performance.
Financial Times (FT) Suggestions: FT often highlights funds, ETFs, or individual stocks through articles, tools like their Fund Comparison Tool, or columns like "Skin in the Game," where portfolio performance is reviewed.
Other Media Metrics: General market indices (e.g., FTSE 100 for UK stocks, S&P 500 for global context) or sector-specific performance can provide a broader comparison.

Source: londonstockexchange.com
Compare with Morningstar Suggestions
Morningstar’s ratings focus on funds and ETFs rather than individual stocks, but we can infer some insights by looking at the sectors in HindeSight’s portfolio and Morningstar’s sector recommendations or fund performance.
Sector Performance: HindeSight includes sectors like Financials (e.g., Legal & General, Rathbones, IG Group Holdings), Utilities (e.g., DS Smith, National Grid PLC), and Mining (Centamin). According to Morningstar’s analysis (as of early 2025), sectors like Utilities and Financials have been mixed. For instance, Utilities often provide stable dividends but lower growth, which aligns with National Grid PLC’s 15.92% return and 19.40 dividends. However, HindeSight’s 36.73% return for DS Smith (Utilities) is exceptional and likely outperforms many Utility-focused funds rated by Morningstar.
Morningstar Star Ratings: Morningstar’s star ratings are based on historical risk-adjusted returns. A study by Vanguard (referenced in Investopedia, 2024) found that Morningstar’s highly rated funds (4 or 5 stars) don’t always predict future outperformance. Only 14% of 5-star funds in 2004 maintained that rating by 2014, and many lower-rated funds sometimes outperformed their benchmarks. HindeSight’s average return of 28.51% over 1.2 years is strong, but Morningstar would caution that past performance (like this) isn’t a reliable predictor of future results. If these stocks were part of a fund, this level of return might earn a 4- or 5-star rating initially, but sustainability is uncertain.
Morningstar Medalist Ratings: Morningstar’s forward-looking Medalist Ratings focus on quality. Funds in sectors like Financials or Utilities with strong management and processes might receive Gold or Silver ratings. HindeSight’s picks, such as Centamin (53.20% return) and BT PLC (37.44% return), suggest high growth, but without knowing the risk-adjusted metrics (e.g., volatility, downside risk), it’s hard to say if Morningstar would rate these highly. High returns often come with higher risk, which Morningstar penalises in its ratings.
Compare with Financial Times (FT) Suggestions
FT provides tools like the Fund Comparison Tool and articles discussing portfolio performance, such as the "Skin in the Game" column (November 2024). Let’s explore:
FT’s "Skin in the Game" Portfolio: In the FT article, the author’s portfolio achieved a 9% return year-to-date and 10% over one year (as of November 2024). This portfolio included UK stocks (13% return), Asian stocks (13%), and Japanese equities (double-digit returns), but was dragged down by a 27% weighting in US Treasuries (4.2% return). HindeSight’s 28.51% average return over a similar time frame (1.2 years) significantly outperforms this FT portfolio. The FT author also noted that the S&P 500 returned three times better than their portfolio (implying around 27-30% for the S&P 500 over the year), which is closer to the newsletter’s performance but still slightly higher.
FT Fund Comparison Tool: FT’s tool (powered by Morningstar data) allows users to compare funds based on performance, risk, and fees. If we were to compare HindeSight’s stock picks to FT-recommended funds in similar sectors, the newsletter’s returns are likely competitive. For example, a Financial sector fund with a 15-20% annual return might be rated highly by FT, but the newsletter’s Financial picks (e.g., IG Group Holdings at 26.74%) exceed this. However, FT emphasises that past performance isn’t a guide to future results, and their tools focus on diversified funds rather than individual stocks.
Compare with Other Media Metrics
Let’s use market indices and sector performance as broader media benchmarks:
FTSE 100 (UK Market Benchmark): Since HindeSight’s stocks are UK-based (e.g., Legal & General, National Grid PLC), the FTSE 100 is a relevant benchmark. Historically, the FTSE 100 has averaged around 6-8% annual returns (excluding dividends) over the past decade, though 2024 saw stronger performance (around 10-12% based on historical trends and FT’s reported UK stock returns of 13%). HindeSight’s 28.51% average return far exceeds this, suggesting the portfolio outperformed the broader UK market.
S&P 500 (Global Benchmark): The S&P 500’s performance, as noted in the FT article, was around 27-30% over 2024, which is very close to HindeSight’s 28.51%. This indicates HindeSight’s portfolio kept pace with global market leaders, which we believe is impressive for a UK-focused selection.
Sector-Specific Performance: Media outlets often report on sector trends. For example, Mining (Centamin’s sector) has been volatile but saw gains in 2024 due to rising commodity prices, which aligns with Centamin’s 53.20% return. Utilities, however, are typically lower growth, so DS Smith’s 36.73% return is an outlier. HindeSight’s sector picks seem to have capitalised on specific opportunities that broader media might not have highlighted in real-time.
Critical Analysis
While we believe HindeSight’s 28.51% average return is impressive, there are caveats:
Risk and Volatility: Neither Morningstar nor FT would endorse a portfolio without considering risk. High returns (e.g., Centamin at 53.20%) often come with high volatility, which Morningstar’s risk-adjusted ratings would penalise. At HindeSight we don’t provide risk metrics, we do use them, but it’s all a part of our methodology so it’s hard for you to assess this part of the equation versus others.
Selection Bias: Here, we have highlighted our recent history which just so happen to be our best-performing picks. We do have some underperforming stocks that are still held and not included in this table (losses are not therefore crystallised), the overall portfolio return will be slightly lower. Morningstar and FT, by contrast, provide more comprehensive data across entire funds or markets.
Timeframe: The 438-day average holding period (1.2 years) is relatively short. Morningstar’s ratings often look at 3-, 5-, or 10-year performance to assess consistency. A 28.51% return over 1.2 years is strong, but HindeSight’s mantra is in, out when the money’s made, then reinvest in the next share.
Media Narrative: Media outlets like FT often focus on diversified funds or ETFs rather than individual stocks. HindeSight’s stock-picking strategy might appeal to active investors, but Morningstar and FT would likely advocate for more diversification to mitigate risk, especially in volatile sectors like Mining or Telecom.
Conclusion
HindeSight’s portfolio, with an average return of 28.51% over 1.2 years, outperforms many benchmarks:
It significantly beats the FT’s "Skin in the Game" portfolio (9-10% return) and the FTSE 100 (10-12% estimated for 2024).
It matches the S&P 500’s performance (27-30% in 2024), which is notable for a UK-focused portfolio.
Compared to Morningstar’s likely recommendations, HindeSight’s returns are competitive, but Morningstar would caution about risk and sustainability. The high returns might earn a 4- or 5-star rating initially, but only if risk-adjusted metrics are favorable.
However, HindeSight’s focus on individual stocks and lack of risk data make it harder to compare directly with Morningstar and FT’s fund-focused suggestions, which prioritise diversification and long-term stability. Investors following HindeSight should be aware of potential volatility and consider balancing these picks with more diversified investments, as often recommended by broader media outlets

‘And then we told them investing was hard work!”