


HindeSight Letters Investment Insights Archive - READ HERE


Our new archive posts allow our subscribers to access valuable insights and analysis and a deeper understanding of market trends and investment strategies that were relevant at the time the HindeSight newsletter was published.
Additionally, reading archived newsletter content can give you a sense of the long term performance of the investments or strategies discussed which can be helpful in making informed investment decisions.
Furthermore reading this content can provide historical context and help you see how market conditions have changed over time, allowing you to better anticipate future developments.
Overall reading our archived content can be a useful tool for gaining a broader perspective on the market.
INVESTMENT INSIGHTS ARCHIVE
Originally posted in April 2019

UNSUPERVISED LEARNING: DEFENSIVE VS CYCLICAL K-MEANS ALGORITHM (CLUSTERING)
Clustering is a technique for finding similarity groups in data, called clusters. It attempts to group individuals in a population together by similarity, but it is not driven by a specific purpose. Clustering is often called an unsupervised learning, as you don’t have prescribed labels in the data and no class values that denote a prior grouping of the data instances are given. In this analysis, we will implement the centroid-based clustering algorithm known as k-means.
These are iterative clustering algorithms in which the notion of similarity is derived by the closeness of a data point to the centroid of the clusters. The k-means clustering algorithm is a popular algorithm that falls into this category. In these models, the number of clusters required at the end has to be mentioned beforehand, which makes it important to have prior knowledge of the dataset. These models run iteratively to find the local optima.

Objective
Traditionally, stocks have been categorised as cyclical and defensive, based on the industry group they belong to. We believe this is too generalised. Instead, by applying machine learning/statistical techniques to group constituents into these two buckets, we want to show that you can achieve better risk-adjusted returns in a manner that makes more sense.
Constructing MSCI Cyclical and Defensive Sectors Indexes
Constituent Selection:
The Indexes are constructed from applicable MSCI country and regional indexes (each, a "Parent Index").
The following GICS sectors are classified as Cyclical sectors:
• Consumer Discretionary
• Financials
• Industrials
• Information Technology
• Materials
All constituent securities from these sectors are included in the MSCI Cyclical Sectors Indexes. The following GICS sectors are classified as Defensive sectors:
• Consumer Staples
• Energy
• Healthcare
• Telecommunication Services
• Utilities
All constituent securities from these sectors are included in the MSCI Defensive Sectors Indexes.
Method
• At each quarterly point, screen the universe for constituents that have been trading for at least 2750 days (approximately 10 years)
• Next, calculate the sensitivity of each constituent relative to the broader market over a 12-month basis
• Apply the k-means algorithm to cluster the constituents into two buckets (cyclicals vs defensives)
• Calculate the quarterly return and then re-evaluate
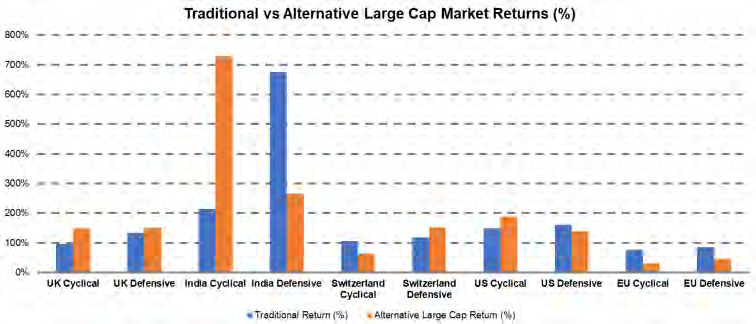
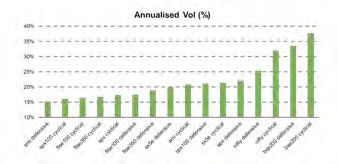
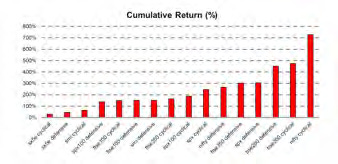
Results
This methodology was applied to broader and large cap markets across the UK, US, Europe (ex-UK), Switzerland and India. Each new index that was produced was compared to traditional cyclical or defensive indices developed by MSCI. We can see that this process performed well across the broader markets with over 80% of observations producing a better estimate of what should be considered as being cyclical or defensive. Most surprisingly, the UK broader market defensive index produced the best risk-adjusted return with a Sharpe Ratio of 2.22 (please see description at the end of the analysis). The Indian equity market (broader and large cap) produced the best cumulative return but with the greatest volatility. It is evident that using this sensitivity methodology enables us to produce more appropriate defensive and cyclical indices.
Note: The Sharpe ratio is used to help investors understand the return of an investment compared to its risk. The ratio is the average return earned in excess of the risk-free rate. Subtracting the risk-free rate from the mean return allows an investor to better isolate the profits associated with risk-taking activities. Generally, the greater the value of the Sharpe ratio, the more attractive the risk-adjusted return.


WHY CHOOSE US?
HindeSight Letters is a unique blend of financial market professionals – investment managers, analysts and a financial editorial team of notable pedigree giving you insights that never usually make it off the trading floor.
We help our paid subscribers have 100% control to build their own portfolios with knowledge that lasts a lifetime and all for the price of a good coffee a month - just £4.99 or save 2 months by subscribing to our yearly plan, only £49.99.
Our history is there for all to see, measure and research.
Visit hindesightletters.com for more information