


HindeSight Letters Investment Insights Archive - READ HERE

Our FREE archive posts allow our subscribers to access valuable insights and analysis and a deeper understanding of market trends and investment strategies that were relevant at the time the HindeSight newsletter was published.
Additionally, reading archived newsletter content can give you a sense of the long term performance of the investments or strategies discussed which can be helpful in making informed investment decisions.
Furthermore reading this content can provide historical context and help you see how market conditions have changed over time, allowing you to better anticipate future developments.
Overall reading our archived content can be a useful tool for gaining a broader perspective on the market.
LIMITED OFFER. GET A 90 DAY FREE TRIAL OF OUR PREMIUM SUBSCRIPTION & MAXIMISE YOUR INVESTMENT POTENTIAL
INVESTMENT INSIGHTS
Originally posted in November 2015
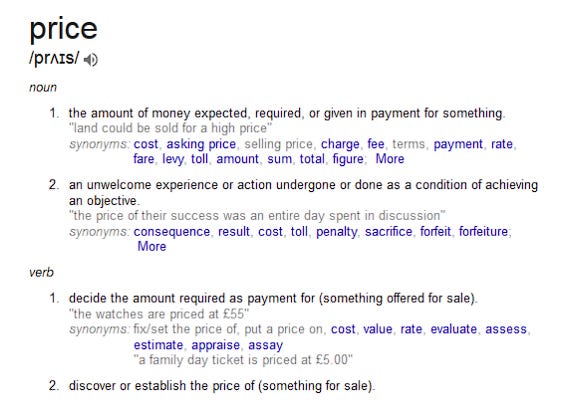
When I read the definitions above of price from the dictionary, like most people the understanding of the word PRICE is considered obvious. Since our earliest childhood memories, we have understood that price usually means the amount of money we have to pay to get something, but price is far more interesting and complex than that. I have been meaning to write this article for a while. Firstly, to focus on price for use in trading and investing and secondly to discuss price in terms of regulation. This month will be Part I:
• Price – the facilitation of trade
• Price and volume
• Financial assets – Trading – Peter Steidlmayer
Early next year will be Part II:
• Price controls
• Price fixing and manipulation
In a freely traded market place, price will fluctuate according to the supply and demand. Everyone remembers the standard supply and demand curves from their first economics textbooks.
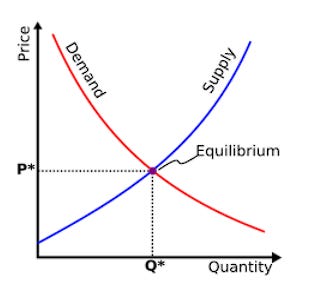
For most products or services, the general rule dictates that if the price drops, demand will increase and as the price rises supply will increase. The equilibrium point will then be the price. However, it must be remembered that prices in many markets change every second of every day, never seemingly in equilibrium. The crux of the matter is to understand that price is constantly trying to discover at what level it can trade, so as to create the most transactions or volume.
The London housing market is an interesting market place to see price and volume currently. The demand for properties under £700,000 is ferocious, and when we say demand we mean that at that price there are 100s of willing buyers with that buying price power. Unfortunately, there are very few sellers at that price for a generic 2-bedroom flat, for example, which means there is very little actual volume. This forces people to either pay a higher price or look at smaller or less central areas.
Low volume means the price is not facilitating trade, it therefore has to move to do so. At the upper end of the market, certainly over £2million, there are many more sellers than buyers at that price point. According to a leading London estate agent, in the last year there have been on average 55,000 properties for sale at any time, inside the M25 over £1million, but in that time there have been only 4,200 actual sales. We can discuss the reasons, such as stamp duty changes and mortgage market review, but the low volume of transactions tells us the same story at this time. Prices are too high and probably 20-30% too high! The market is being pushed into the centre from both sides, as the price tries to do its job and discover the level at which most transactions occur.
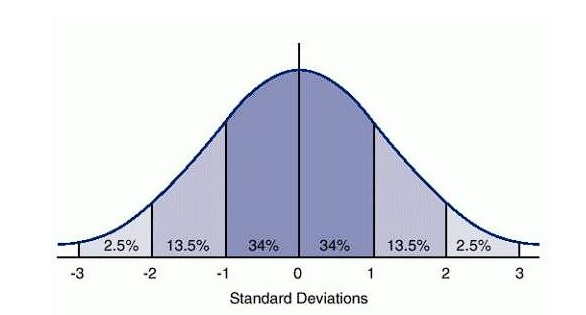
In probability theory, the central limit theorem (CLT) states that, given certain conditions, the arithmetic mean of a sufficiently large number of iterates of independent random variables, each with a well-defined expected value and well-defined variance, will be approximately normally distributed, regardless of the underlying distribution. To illustrate what this means, suppose that a sample is obtained containing a large number of observations, each observation being randomly generated in a way that does not depend on the values of the other observations, and that the arithmetic average of the observed values is computed. If this procedure is performed many times, the central limit theorem says that the computed values of the average will be distributed according to the normal distribution (commonly known as a "bell curve"). A simple example of this is that if one flips a coin many times, the probability of getting a given number of heads should follow a normal curve, with mean equal to half the total number of flips.
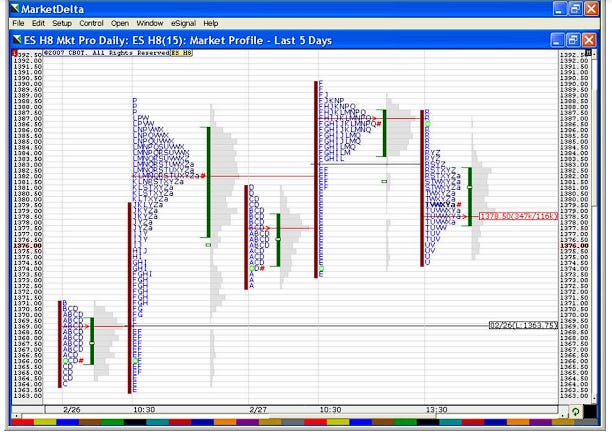
In the 1970s, Peter Steidlymayer, a trader on the Chicago Board of Trade, noticed that the prices of many asset classes conformed to a typical normal statistical distribution over the day, with most of the volume going through at the middle of the day’s range and tailing off as the price rose or fell. His initial methodology for tracking this was to list every price print by hand in a half-hour period as a letter, starting with A for the period for 08:00-08:30 Chicago time, and continuing through the alphabet for each subsequent half-hour period. Crucially, he assumed that in an active market place, the more time spent at a price, the greater the volume. This may clearly not be the case in all asset classes, but it is volume that we are primarily interested in. He introduced his studies to the CBOT as a system called Market Profile in 1985. Any trader of US bond futures since then will have heard of the system. I was working for Midland Montagu a few years later and was sent the demonstration videos to watch by our San Francisco trading manager.
It has been part of my investment and trading philosophy ever since. Understanding that price is trying to facilitate trade is the most important tool in understanding not only what is currently occurring, but more importantly where the price is heading towards in the future. You have to be on the lookout for low volume areas at all times, either they are suggesting a price that is too low or the price is too high. They are often known as buying support areas and selling resistance areas. The price will tend to move away from those low volume points, often quite aggressively. Trading professionals use market profile to place buy or sell orders at known low volume points, as well as the more dynamic use of looking for unbalanced markets up or down (Trending) over several trading sessions where the price volume analysis is ONLY showing low volume lows OR highs on several days, rather than both suggesting continued demand or supply that has not been met so far. This is a state of imbalance and the price continues to move.
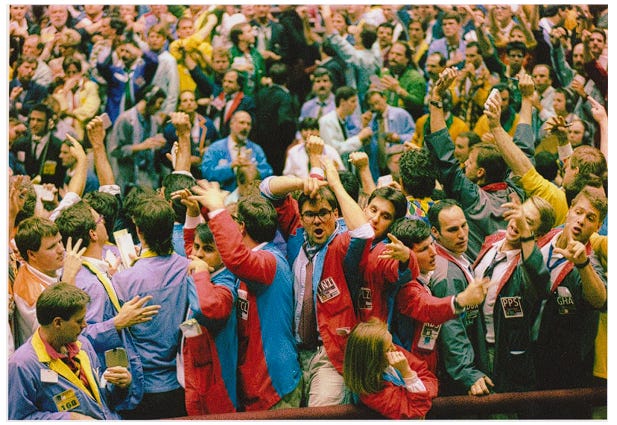
US Chicago Board of Trade US Bond Futures Pit 1995.
This is my favourite picture of the Chicago Board of Trade US bond futures pit that I have on my study wall at home. I visited our brokers in Chicago a few years before this photo was taken and was in awe of the organised pandemonium with which 1000s of orders went through, a far cry from the eerily quiet electronic business of today’s trading floors. US Treasury bond futures used to trade in increments of 1/32nds between the big points. In the picture, you can tell from the hand signals that the current price is 9 bid with an offer at 0; however, this could be 9-10, 19-20 or 29-30. Actually, the board above would confirm that. The hand signal for 9 bid (buyer) is 4 fingers at the horizontal with palm towards the body, the signal for 0 offer (seller) is a clenched fist with palm away from the body. In those days, you could see very visibly if there were more sellers than buyers as you would see many more palms facing you than away. In the picture above it looks like there are more sellers at 0 than buyers wishing to pay 9 by a reasonable margin.
Higher prices always eventually bring out selling volume and lower prices eventually bring out buying volume. In stock markets, it is worth remembering that when you hear about more sellers than buyers, it is only about at that specific price. In the last mini-crash in August, we had several days where the number of sellers at declining prices continually outweighed the buyers at those levels, but someone always owns the stocks. They just change hands at differing prices. Usually the owners of the stocks at the top of bull markets are the short-term speculators, the proverbial shoeshine boys. At the lows, the longer-term investors, such as pension funds are usually the holders of stocks as the long-term value meets their liability requirements. The lows and highs of prices in markets on any time period from hours to years is determined by each market participant collectively who is responding to his own desire in transaction. High end London real estate has been influenced by crazy high prices paid by the Russian or Middle East billionaires on several thousand properties. However, these high prices have brought out many more willing sellers of £5million Chelsea properties, over 10-1 ratio apparently. AT THIS TIME, it is very unlikely that prices will be able to move higher. Property, more than most assets, goes through periods of non-facilitation where transactions dry up and yet the price doesn’t drop enough or quick enough to increase volume.
Whether you are a market professional or a passive investor, learning more about price/volume analysis, and in particular Market Profile, will certainly stand you in good investment stead.
Over the last year, most stock markets have generally flatlined with occasional 5-15% downdrafts before recovering. Our resource heavy UK stock market has fared worse but is still underpinned by zero interest rates.
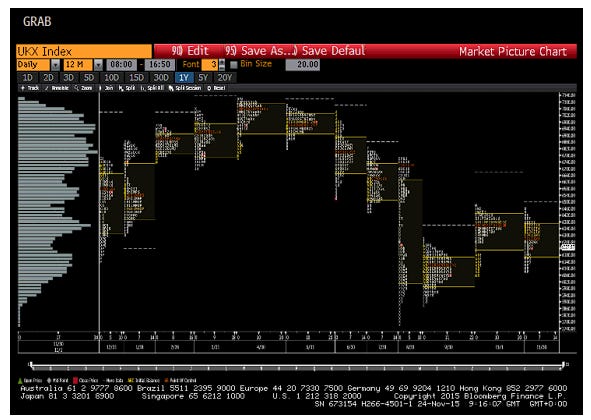
FTSE 100 Market Profile analysis
The above diagram shows the A, B, C lettering for the monthly time price trading, with the full volume for the period on the left-hand side. We can see clearly that not only does volume drop off at the lows towards 6000, as many more buyers show up and at the highs above 7100, as the sellers show up, but also around the 6200 area and 6500 area. These clearly split the main distributions. From a recent trading perspective, it should come as no surprise to the market profile trader that despite the tragedies of the Paris attacks, the lows seen on the following Monday at 6000 were extremely short-lived with no volume and the market bounced straight up towards 6400 highs and were rejected with no volume. For now, price has discovered that it can generate the most volume around 6200-6350 and so continues to do so.
Rounding up the investment insights for this month is a brief look at the matrix of the monthly seasonal movements in the FTSE 100 index over the last 15 years.

As we have pointed out before, Q4 of the year is on average the best performing quarter with December the most positive in terms of occurrences. From a seasonal mentality, the two best months for purchasing stocks are generally September and January. It we combine that with other tools, such as volume price analysis, our odds of profitable success can only increase. Until next month.
N.B. Price is part of an exchange agreement for goods and services between 2 people at an exact time. If they can’t agree, there is no trade. The advertised selling price may be just as unrealistic as the proposed buying price in the result of non-agreement. If a trade occurs the price at which it is made is historical, bearing a reference point for future transactions. But there is no guarantee that they will be exchanged at this price again.

WHY CHOOSE US?
HindeSight Letters is a unique blend of financial market professionals – investment managers, analysts and a financial editorial team of notable pedigree giving you insights that never usually make it off the trading floor.
We help our paid subscribers have 100% control to build their own portfolios with knowledge that lasts a lifetime and all for the price of a good coffee a month - just £4.99 or save 2 months by subscribing to our yearly plan, only £49.99.
Our history is there for all to see, measure and research.
LIMITED OFFER. GET A 90 DAY FREE TRIAL OF OUR PREMIUM SUBSCRIPTION & MAXIMISE YOUR INVESTMENT POTENTIAL
Visit hindesightletters.com for more information