

HindeSight Letters Investment Insights Archive - READ HERE
HindeSight Letters Investment Insights Archive - READ HERE

Our FREE archive posts allow our subscribers to access valuable insights and analysis and a deeper understanding of market trends and investment strategies that were relevant at the time the HindeSight newsletter was published.
Additionally, reading archived newsletter content can give you a sense of the long term performance of the investments or strategies discussed which can be helpful in making informed investment decisions.
Furthermore reading this content can provide historical context and help you see how market conditions have changed over time, allowing you to better anticipate future developments.
Overall reading our archived content can be a useful tool for gaining a broader perspective on the market.
LIMITED OFFER. GET A 90 DAY FREE TRIAL OF OUR PREMIUM SUBSCRIPTION & MAXIMISE YOUR INVESTMENT POTENTIAL
INVESTMENT INSIGHTS
Originally posted in December 2014
60:40 Portfolio Management by Ben Davies & Mark Mahaffey
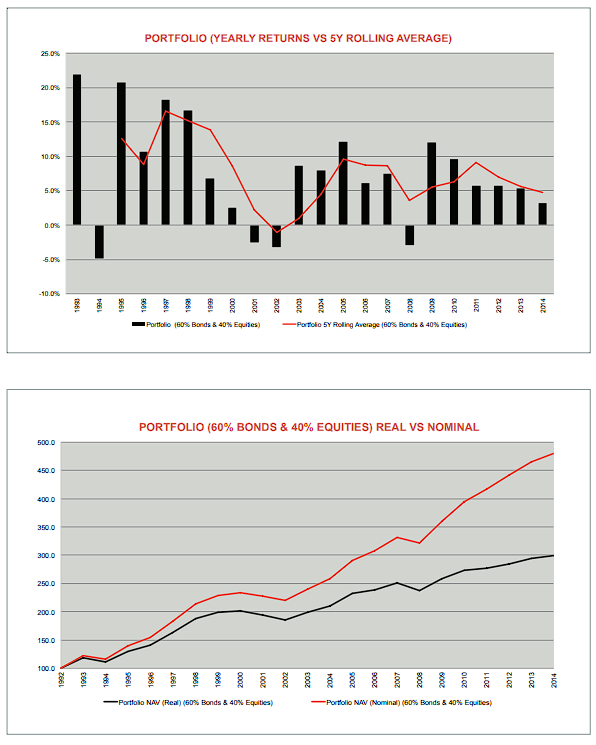
Year to date in 2014, a typical portfolio of 60% bonds and 40% equities has made over 4% return. Although this might seem a meagre return historically, against a backdrop of zero interest rates and fat equity prices it cannot be sniffed at.
• Since 1993 the average yearly return for a 60/40 UK bond/equity portfolio has been 8%
• With only 4 losing years out of 20 and a worst yearly loss of 5%
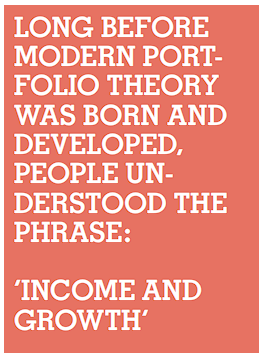
This has allowed a saver to make a compound return of £500 from every £100 invested over that time. Even inflation adjusted, the real return is a stellar £300.
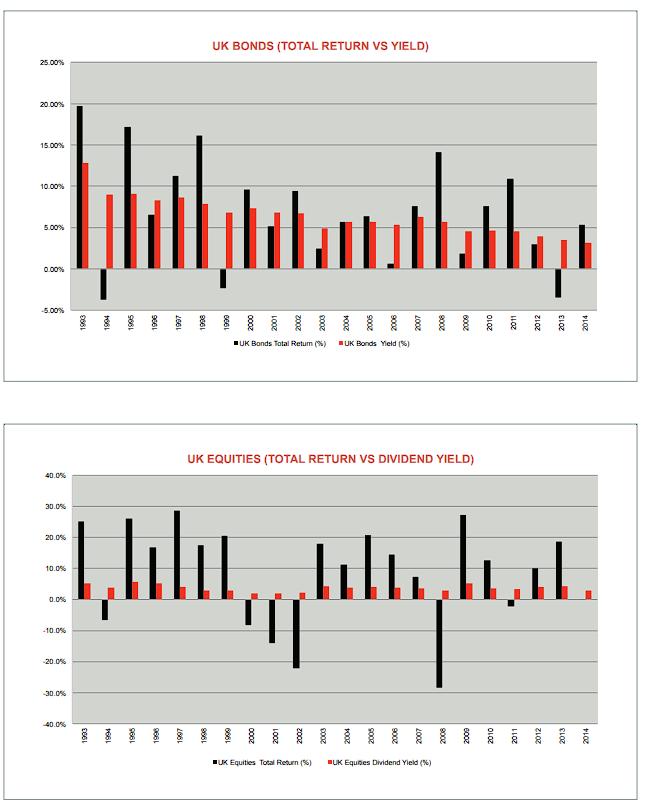
Long before modern portfolio theory was born and developed, people understood the phrase:
‘INCOME and GROWTH’
It is still on the lips of every Independent Financial Advisor (IFA). Would you like income and growth?
It’s a no brainer. Of course I want income and growth for my hard-earned savings pot. Who wouldn’t?
The usual discussion revolves around how the ratio of bonds to equities is most suited to its client. This would typically be presented as an age-related strategy. More growth required by younger people and more income by older people. So the portfolio split might start of more weighted to equities in the early years and end up more weighted to bonds towards and into retirement.
For the purpose of this analysis we will stay with a 60% bonds and 40% equity split.
We have used the UK 5-7 average maturity bond index and the FTSE 100 index as our benchmark return indices.
The income comes from coupon (usually semi-annual) on the bonds and the dividend payments on the equities.
The growth will come from rising prices of equity markets as inflation and growth of world economies and populations continues. In other words, there is a nominal appreciation in equities which is not fundamentally based on the stock-specific dynamics.
The returns you see in the charts have been made by the basic indices alone – a portfolio with a wider selection of FTSE 350 companies and incorporating higher yielding corporate bonds run by a reasonable fund manager would no doubt have made considerably more.
However, these ‘dream years’ have relied on 3 basic aspects:
• Interest rates have been in a long-term declining trend, so bond prices have risen accordingly while paying a healthy coupon
• Equities which have been in a general uptrend albeit with a few big down years are back to their highs
• The negative correlation between bond prices and equities has been consistent
In the 4 losing years out of 20, the worst loss was in 1994 – almost 5%. This was also the only year that equities and bonds made losses at the same time.
In the other 3 losing years which coincided with severe equity sell-offs in 2000-2002 and again in 2008, interest rates dropped and bond prices rose dramatically enough to mitigate the losses to less than 3.5% overall. Bearing in mind the equity market was down almost 30% in 2008, this was no mean feat.
Note - If you lose 33% in one year, you have to make 50% the next to get back to break even, that’s the bad part of maths.
Stocks down, bonds up! This is so engrained in market participants psyche nowadays, it’s hard to believe that before the 1987 stock market crash this wasn’t a view widely held. These days whether it’s the total belief that the central banks will always supply liquidity at the first hint of equity troubles or a fall in real money flows, the negative correlation factor between bonds and equities is considered a given.

Unfortunately, all good things do in fact come to any end. Healthy bond coupons with rising bond prices are facing a big limiting factor.
‘ZIRP’ – Zero Interest Rate Policy – 0 % is the limiting factor for long duration bonds.
Not only are you currently getting hardly anything in the way of bond coupons, your scope for further price appreciation is in doubt on the approach to zero. While some interest rate curves are peeking into negative territory this is a big wall, make no mistake.
The problem is compounded by the potential for never-before-seen magnitude losses in 5-7 year sovereign debt. When bond yields were at their average of 6%, a 1% move to 7% would move a 100 (par) bond price to 95, a 5% loss.
From the 1% current interest rates, a move back to 6% average yield would have a shocking loss of 20% of face value.
Central bank lowering of interest rates to keep the economy on its feet has propelled some asset markets, namely property and equities to historically high valuations.
Clearly this is a very troubling scenario. If equities sell of heavily from here, bonds will not be able to mitigate the losses as they have in the past. If bonds sell of, equities are likely to crash as a result of higher interest rates, compounding the losses.
The passive investor with a typical 60% bond, 40% equity portfolio is not only facing the worse future income stream ever, he is facing the biggest drawdown in modern times.
This does not even take into account the related investments made by many an investor in the search for yield.
Corporate bond holdings and smaller capitalisation equities are much too oversubscribed to and have even higher valuations than is historically the norm.
Unfortunately for most people, there is little they can do to avoid this coming tragedy. Most pension fund managers are compelled to get what little yield they can from the bond sector, regardless of the obvious terrible skew in credit risk profiles.
Most months in this newsletter we will try to highlight investment opportunities and concern ourselves with building the portfolio construction with an eye to these risks. While there isn’t time to answer every question on this current portfolio concern everyone should at least consider all their choices:
• Bonds come in all shapes and disguises – sovereign, corporate, infrastructure. Find out how much you have in ‘Fixed Income’ assets of your portfolio
• Try to find out the average maturity or duration of these bonds. The longer the maturity, the more the yield, the more the risk.
• As these bonds are receiving less and less in terms of yield and negative correlation equity protection, consider switching your portfolio into very short-term cash equivalent securities, like Treasury Bills. (Remember, while cash deposits might only be safe up to £85,000, Treasury Bills in a custody account are secure)
With a higher cash weighting, your 40% equity portfolio mix is diluted to an extent but it is always worth remembering that:
• Less volatile, higher dividend stocks (as recommended in this newsletter) currently have much more bond-like characteristics (ie income with less risk) than in the past
• Gold at its current price will add some negative correlation portfolio insurance value to an equity/property heavy portfolio and might well add some value to any concerns about hyperinflation. Right now though gold will offer protection from default risk. Gold is nobody’s liability.
• We recommend 10 to 20% depending on your equity to bond holding and any commodity exposure
• For the more sophisticated investors in this DIY investing revolution, consider hedging part of any equity portfolio by using a straightforward FTSE index short position with an account at a spread betting firm

WHY CHOOSE US?
HindeSight Letters is a unique blend of financial market professionals – investment managers, analysts and a financial editorial team of notable pedigree giving you insights that never usually make it off the trading floor.
We help our paid subscribers have 100% control to build their own portfolios with knowledge that lasts a lifetime and all for the price of a good coffee a month - just £4.99 or save 2 months by subscribing to our yearly plan, only £49.99.
Our history is there for all to see, measure and research.
LIMITED OFFER. GET A 90 DAY FREE TRIAL OF OUR PREMIUM SUBSCRIPTION & MAXIMISE YOUR INVESTMENT POTENTIAL
Visit hindesightletters.com for more information