HindeSight Letters Investment Insights Archive - READ HERE
Our new archive posts allow our subscribers to access valuable insights and analysis and a deeper understanding of market trends and investment strategies that were relevant at the time the HindeSight newsletter was published.
Additionally, reading archived newsletter content can give you a sense of the long term performance of the investments or strategies discussed which can be helpful in making informed investment decisions.
Furthermore reading this content can provide historical context and help you see how market conditions have changed over time, allowing you to better anticipate future developments.
Overall reading our archived content can be a useful tool for gaining a broader perspective on the market.
INVESTMENT INSIGHTS ARCHIVE
Originally posted in March 2019
The analytical research that we have developed at Hinde Capital over the years has had many sources of origin; hopefully, some more original than others. Certainly, some of the stock picks and timing has proved out much of the work in the real world of profit and loss.
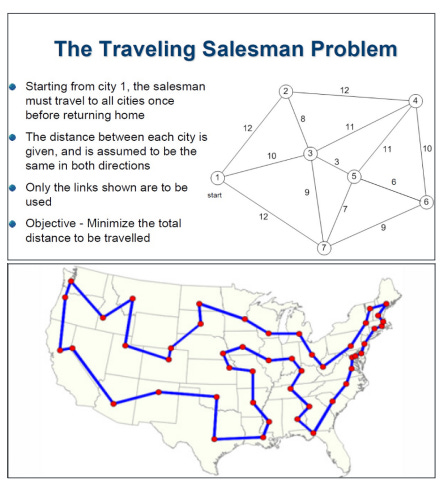
One such analysis, which we refer to in-house as the ‘Path analysis’, has been derived from a problem that was first recorded in the 19th century as the ‘Travelling salesman problem’.
Mathematicians W.R. Hamilton and Thomas Kirkman formulated the problem in the 1800s but it has been increasingly of interest since, with institutions like the Rand Corporation offering prizes for any progress on the puzzle.
The simple observation that one first goes from a starting point to the closest point, then to the next closest point, and so on, does not generally yield the shortest route. Hence, the need for a suitable solution.
For decades, algorithms have been sought that look for exact solutions rather than just brute force trial and error. Despite the rather dated thought of a travelling salesman plying his wares across the country, this problem is all around us in the modern world. Whether it is the connection of electrical cabling, Amazon delivery drivers’ routes or the flow through in-chip circuitry, there is continued interest in making improvements.
Prim’s algorithm is a mere footnote in the history of the problem, but the concept of minimum spanning trees have ignited some ‘Eureka’ moments in the Hinde Capital office when we were looking for alternative mean reversion measurements across the UK FTSE equity components. While many analysts look at specific individual companies and make evaluations about their value, our research has focussed on looking at every single stock in the index, as we believe the performance across the whole spectrum will tell us much about both the UK economy as a whole and the cycle it is following.
We are constantly looking for ‘cheap’ large stocks, with a margin of safety, that are temporarily out of favour and have either cyclical poor margins or built-in bad news. While our analysis does focus on the potential for growth, this pales in comparison with our focus on value.
The Hinde Capital Path analysis starts with the assumption that every stock in the index has a relationship with every other stock as a series of pairs, e.g. SHELL-VODAFONE. We can measure the ‘distance’ between the pairs in many similar ways to Prim’s minimum spanning tree. Readers may prefer to think of the SHELL-VODAFONE as an orbiting pair of planets in the galaxy.
If we just use the FTSE 100, we have (100*100)/2 = 5000 paths or orbits to consider, SHELL-VOD being the same as VOD-SHELL. However, if we use the FTSE 350, we have 61,250 paths to consider. As you can imagine, the computing/coding power needed is quite different.
In selecting the ‘top 20’ cheapest stocks by the Path analysis, we make various measurements and observations. Unfortunately, we can’t give away the exact details of our proprietary process but the crux of the analysis is:
• The path analysis does not focus on whether a certain stock is distant/cheap in orbit from the index. It focuses on how the stock’s orbit or path is relative to every single other stock in the index independently, either with 5000 paths to consider or 61,250.
N.B. In all aspects of finding ‘value’ through mean reversion, whether it is comparative market capitalisation or orbiting paths, the assumption that ‘gravity’ will prevail does not always happen, i.e. when stocks go to much lower values (out of their regular orbit) or even zero, like Carillion. It is extremely important to have rigid stock losses in place to reduce this risk. We always exit losing positions at 25% losses without hesitation, and that applies to both HindeSight letter recommendations and Hinde Capital’s models. No stock that is deemed to be ‘cheap’ by our models should lose that much without a need to exit and re-evaluate.
Current Path Analysis for FTSE100
WHY CHOOSE US?
HindeSight Letters is a unique blend of financial market professionals – investment managers, analysts and a financial editorial team of notable pedigree giving you insights that never usually make it off the trading floor.
We help our paid subscribers have 100% control to build their own portfolios with knowledge that lasts a lifetime and all for the price of a good coffee a month - just £4.99 or save 2 months by subscribing to our yearly plan, only £49.99.
Our history is there for all to see, measure and research.
Visit hindesightletters.com for more information
.


