HindeSight Letters Investment Insights Archive - READ HERE
Our new archive posts allow our subscribers to access valuable insights and analysis and a deeper understanding of market trends and investment strategies that were relevant at the time the HindeSight newsletter was published.
Additionally, reading archived newsletter content can give you a sense of the long term performance of the investments or strategies discussed which can be helpful in making informed investment decisions.
Furthermore reading this content can provide historical context and help you see how market conditions have changed over time, allowing you to better anticipate future developments.
Overall reading our archived content can be a useful tool for gaining a broader perspective on the market.
INVESTMENT INSIGHTS ARCHIVE
Originally posted in August 2017
We are always looking for topics for our letter, especially the Insight section. One of our readers has helped us this month by sending in his early 2008 ‘blue chip’ portfolio that he constructed at the time. Although he closed out the portfolio within a few months for a small loss, being worried about the overall stock market, we can still analyse the portfolio and discuss the buy and hold strategy.
If you read many of the ‘expert’ financial opinions today on investing in the equity market, the consensus will focus on low-cost Exchange Traded Funds on equity indices, starting with your home country. The belief that in the long-run equity markets always tend toward higher prices, while most of the returns come from large compounding dividends, is generally borne out by history. It is certainly better believed when the stock markets are at cyclical highs as they are currently.
In the table below are the stocks selected back in early 2008. Some may not seem as ‘blue chip’ as others, but times change. We will take it from our reader’s letter that he thought this was a fairly defensive, low risk and dividend-paying portfolio with the ability to experience growth as well. You can see some household names, banks, supermarkets, and so on.
You can see the ten-year price change and the differing nominal returns with the total returns, which include all the dividends, regular or special with capital repaid and share adjustments. Many people will be surprised at the extent of the differences between losses and gains, with Premier Oil losing 80% and United Utilities gaining 105% in total return, but this is typical of any long-held portfolio.
It is the total return which is key. This is the actual return of the portfolio held for that period with all the dividends and disbursements received and reinvested. No income has been taken from the portfolio. The charts show the movement of the portfolio over time.
Unfortunately, the starting point in this case was not the best, coming one year before the depths of the great financial crisis, with both portfolios experiencing 50% losses earlier on. Thank God, the canny reader was an ex-city trader and didn’t hold it for that period. But over time, the power of mean reversion and monetary press printing with the dividends meant the portfolios clawed their way back. Today, the nominal portfolio is down 12% but you have had all the benefits of potentially living on the income, while the total return portfolio is up 30%. It has to be noted that this gain has happened all in the last year. In March 2016, the total return portfolio was flat for the eight-year period
What does this tell us about a buy and hold strategy? Firstly, the starting point is very important and secondly, dividends continue to make up a major part of any long-term returns for large cap companies, maybe. But the assumption that even with a poor starting point, all comes good in the end is a poor one. The long term can be far longer than you expect. And what if you not only need to live on some income from the investment but also, heavens above, have to unavoidably take some monies out of your portfolio at a low point. Your portfolio recovery would be much worse. The chart below shows a theoretical cash withdrawal of 25% of monies at the 2009 low point and subsequent muted recovery.
If we look at the last 20 years of the FTSE nominal and total return charts, we can see that an equity portfolio has twice so far seen 50% losses in that period before 100% gains. The argument for long-term pound cost averaging by your IFA might seem strong, but we have spoken to many clients in 2003 and 2009 who saw these losses as very real. Only the benefit of hindsight allows us to praise the power of long-term holding.
Maybe the investors in the Japanese stock market over the last two decades felt the same but it hasn’t worked quite so well. But that’s different, right? The UK property market and UK stock market always goes higher, surely? No matter what happens, even after Dunkirk!
John Hussman of Hussman funds tells us that the CAPE (Cyclically Adjusted Price Earnings), normalised for profit margins, is currently trading at 40 times. Only once in history has it traded higher, in the week of March 24th 2000, before the stock market collapsed. Hussman’s Median Price/revenue chart has us at the most extreme in history by any reckoning.
More than ever, we are paying very high prices for stocks versus their earnings and potential earnings. Historically, at these multiple levels, the investor’s wealth has typically suffered huge drawdowns. While the consensus outlook is more blue sky with not a care in the world, time may not be on our side.
For a simple example of the current situation, look at Exxon Mobil, one of the largest oil companies in the world. Five years ago, when oil was still trading over $100/barrel, Exxon’s earnings were $32bn a year, roughly 10X Price/Earnings multiple to the then market capitalisation size of $350bn. As we all know, the oil price has fallen 50% to sub $50/barrel, so it should come as no surprise that Exxon’s earnings today have also halved to $15bn a year. What should come as a surprise is the market capitalisation is still $350bn because the P/E ratio is now 20X earnings!!! Why on earth would investors think that paying DOUBLE the historic value of Exxon’s earnings is a good deal? The only answer you typically hear is, well interest rates are so low, what else can I do?
One of my favourite quotes is from ‘The Magnificent Seven’ when the chief baddie utters: “If God did not want them sheared, he would not have made them sheep,” which is appropriate I feel at this juncture.
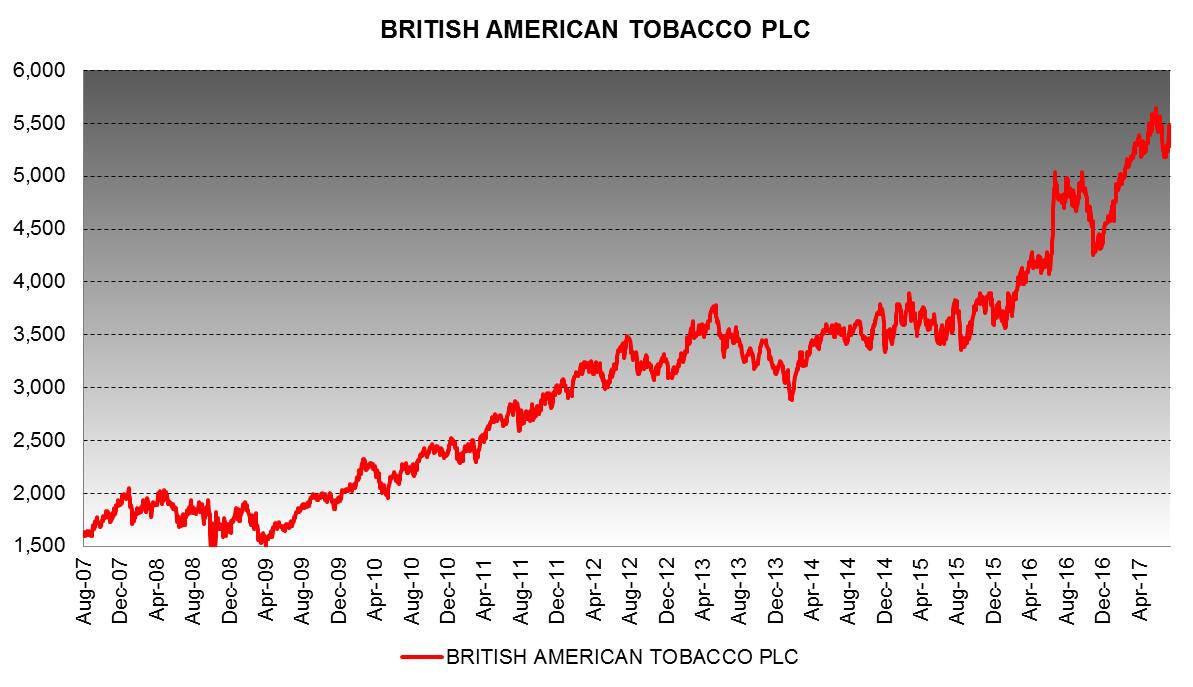
Is there a safe way to invest in equities today, then? Arguably, today, like in 2000 and 2007, it is one of the worst times in history to be invested in equities, whether you’re just starting or are fully invested. What stocks might you pick for your ‘blue chip’ long-term buy and hold portfolio today? Shell, BP, HSBC, British American Tobacco, Taylor Wimpey, perhaps?
Would you not worry that oil companies, especially those trading at 20X earnings, might have gone out of business when we have electric cars in 2040?
Would you not worry that crypto-currencies will challenge the banks in years to come for a share in the profits of moving money around?
Would you not worry that the world will smoke less and less and tobacco companies will have no consumers left for their product?
Would you not worry that the housing market is rolling over and the government’s withdrawal from the ‘Right to buy’ will affect homebuilders’ profits considerably?
Of course, you should be worried about your personal wealth and investments at all times, but especially when you are overpaying for all your investments historically, whether they are bonds, equities or property. Complacency may be very costly.
I saw a quote today from the Head of Pantheon Macroeconomics, Ian Shepherdson, that reverberated with me:
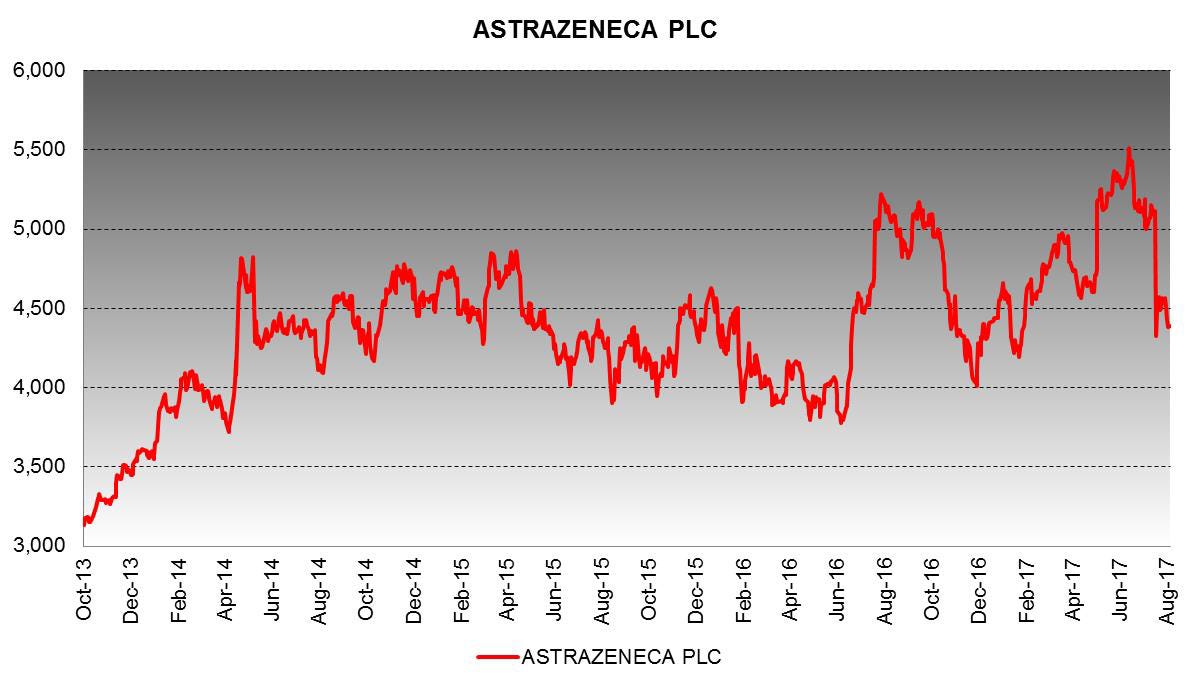
In the last few weeks, we have seen a few of the perfectly priced large cap UK stocks tumble sharply on slightly negative news, all unfortunately held by the legendary Neil Woodford’s funds. That is the problem, when you are priced for perfection, it doesn’t need much to tip the proverbial apple cart. The harsh reality is that at this juncture, too many asset classes are far higher than their historical values and have a far greater probability of loss. As such, we continue to recommend a much higher cash holding in portfolios than normal which should be seen as a strong positive investment choice rather than an un-allocation.
WHY CHOOSE US?
HindeSight Letters is a unique blend of financial market professionals – investment managers, analysts and a financial editorial team of notable pedigree giving you insights that never usually make it off the trading floor.
We help our paid subscribers have 100% control to build their own portfolios with knowledge that lasts a lifetime and all for the price of a good coffee a month - just £4.99 or save 2 months by subscribing to our yearly plan, only £49.99.
Our history is there for all to see, measure and research.
Visit hindesightletters.com for more information
.


