


HindeSight Letters #89 June 2022 - NEWSLETTER


Friday August 5th 2022
Subscribe to The HindeSight Letter and reap the benefits of understanding the Macro forces driving the financial markets, as well as receiving email alerts detailing portfolio changes to the HindeSight Dividend portfolio, that covers FTSE350 stock as suggested by our Hinde Dividend Matrix and seasoned money managers.
HindeSight Publishing which runs HindeSight Letters is a unique blend of financial market professionals – investment managers, analysts and a financial editorial team of notable pedigree giving you insights that never usually make it off the trading floor.
We help our paid subscribers build their own portfolios with knowledge that lasts a lifetime and all for the price of a good coffee a month - just £4.99.


OVERVIEW
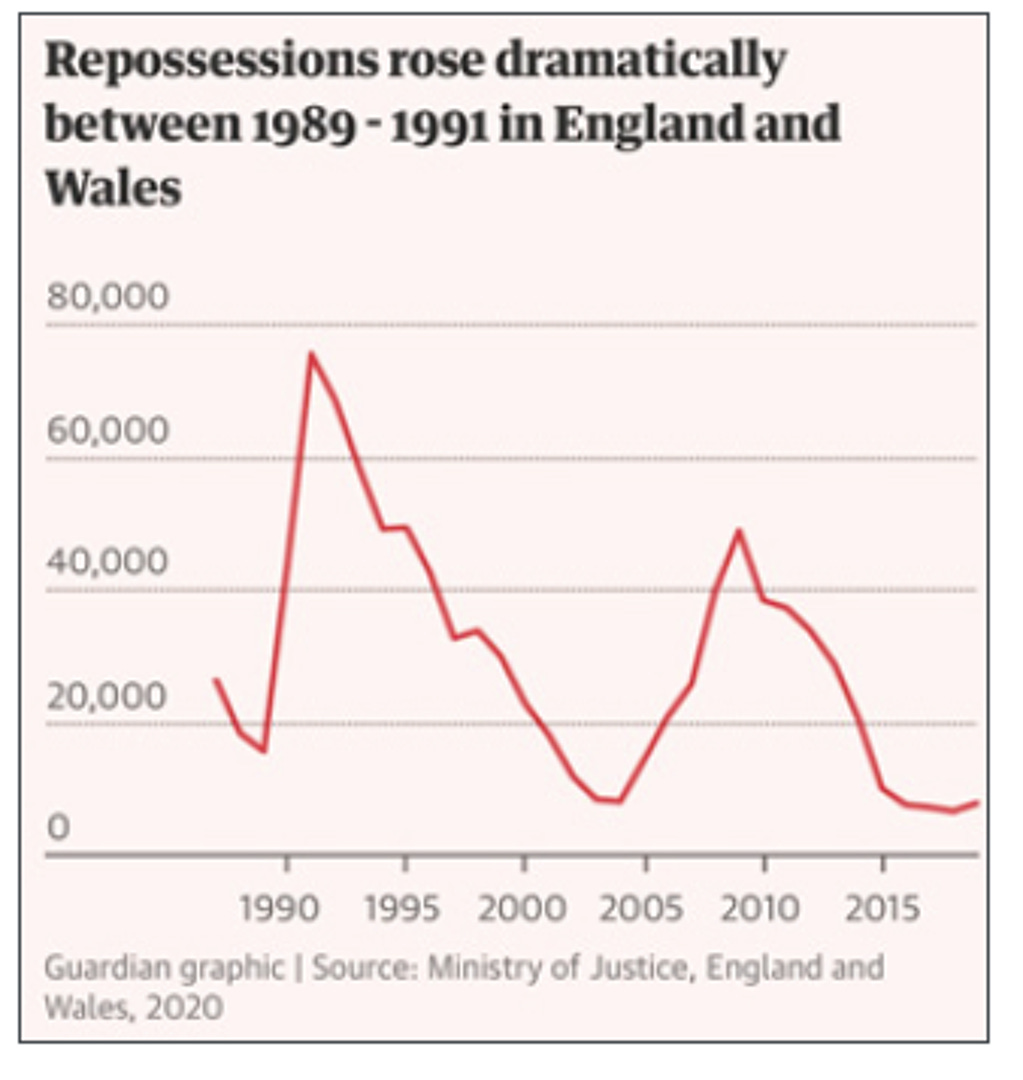
The strong growth in the UK economy in the late 1980’s saw house prices soar, especially in London and the South East. Unfortunately, the growth spurred inflation, leading the authorities to raise interest rates, which brought the economy to a grinding halt and a subsequent recession, acutely felt in the housing market. I can remember the new topic of discussion then, was “negative equity”, (your mortgage loan greater than your house value), as rising mortgage payments led to real struggles as disposable income declined, with banks forcing foreclosure at a record rate, and job losses accelerating borrowers to “hand their keys back”.
The selection of charts below shows the sorry story.
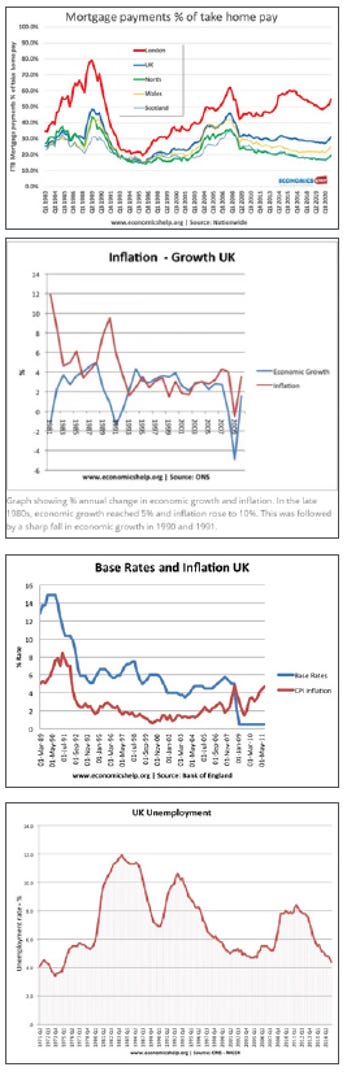
House price transactions quickly dried up, as the bid-offer spread widened, with the sporadic low prints, often down 30-40% from 1989 prices, being made on probate or repossession sales, while the following decade till the turn of the millennium, saw dinner party discussion on the matter, only in the negative. The untenable ‘high’ house price/income over 5x in 1990, would take wage increases most of the decade to ‘normalise’ to only 3x.
Obviously, you know where I am going with this, with today’s jaw-dropping price/income ratio approaching 10x, with average house prices at £330,000 and average wages of £39,000, house prices have been primarily driven up by the insanity of central bank money printing and near zero mortgage rates, allowing ‘extended’ affordability in this period, although still out of the reach of a growing number of young people. But, with the projections of 10% inflation once again, with the central banks far behind the curve, (Bank of England base rate 1.25% today compared with 14% in 1991, at the same inflation levels), we should be very fearful of these historical events and the consequences in the near future.
In the US, usually ahead of the UK, the ripples of fear are already spreading. 30 year mortgage rates, which are the prime drivers for US house price analysis have risen from 3.5% to 6% since January. The short explanation below is just as relevant in the UK to the US.
Housing affordability explained:
BofA does a great explanation with some easy math:
A consumer purchasing a $400.000 home with 20% down would see her mortgage payment increase 34% with a 6% mortgage rate v.s. a 3.5% mortgage rate. Conversely. if the consumer wanted to keep her mortgage payment constant, the maximum purchase value of the home would need to decline 25% to ~$299.600
This is not rocket science, but you get the main points, buyers are priced out .. leading to a reduction in demand.
To continue reading please subscribe for the price of a cup of coffee per month, only £4.99.