

Ever Wanted To Understand Money Markets?
Our monthly newsletter is for novice investors or seasoned money managers and uses plain English to give an overview of the markets as well as at least one share a month that we believe is worth a more in-depth look.
Our aim is to educate everyone on investing and democratise the insights usually only accessed by seasoned investors from the trading floor.
Education allows better decision making and provides a bedrock to build on for the future.
Each month we will showcase why a certain share is on our radar, and the case for why it should be on yours too.
There is a market overview as well as writing about different strategies and why they are important.
Pair this with our alerts which indicate historical lows and highs for the selected monthly share insights and you have a powerful portfolio builder in your pocket.
25 Consecutive Winning Stocks:
Proven Investment Strategies For 2024
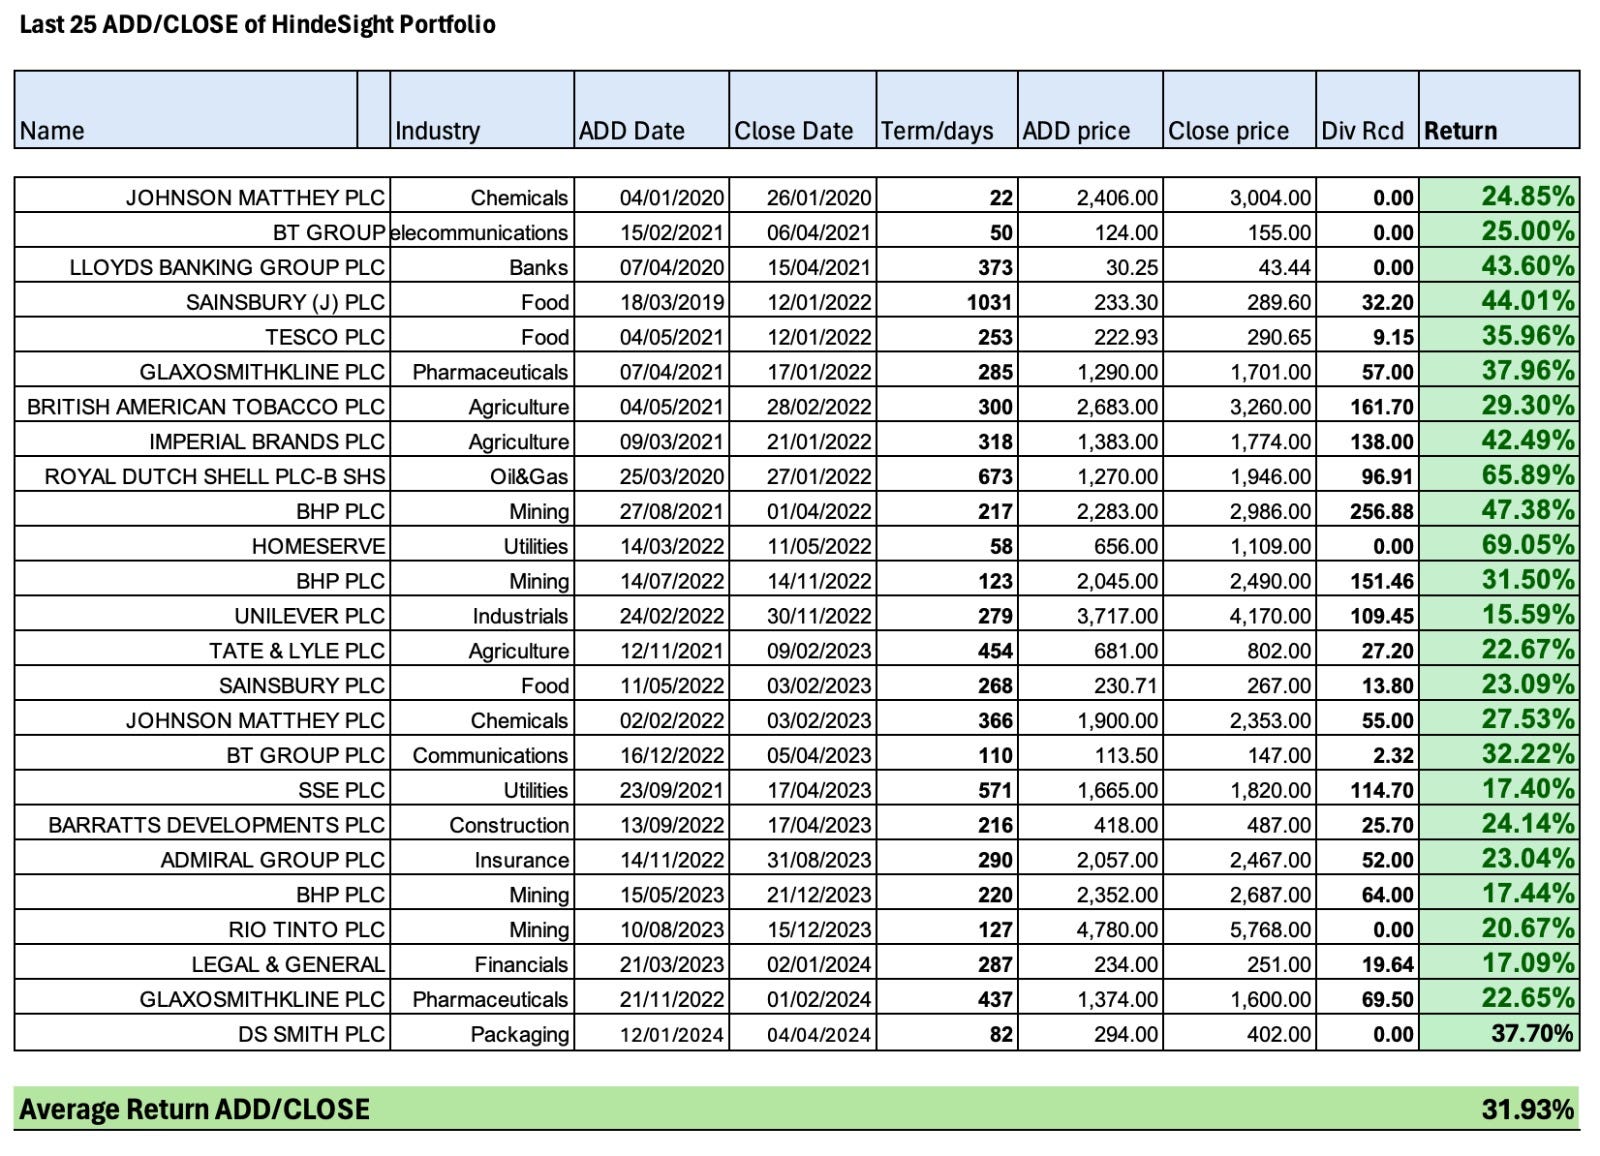
Discover The Power Of Consistent Success With HindeSight Investment Letters.
Our expertly curated investment alerts have secured 25 consecutive gains, offering you proven strategies for 2024 and beyond.
Whether you’re a long-term investor seeking to build a profitable portfolio or you’re looking for reliable stock picks, our service provides unmatched insights into the stock market.
Maximise your returns and enhance your investment knowledge with our timed stock add and close alerts.
Don’t miss out on the opportunity to leverage our winning streak for your financial growth. Join us now and start transforming your investment approach with our top investment tips.
While we’ve achieved 25 consecutive successful alerts, it’s important to remember that the value of investments can fluctuate, and past performance is not indicative of future results. All investors should conduct their own research and consider their financial circumstances and risk tolerance before investing.
Subscribe To Our Newsletter & Start Your Investment Journey Today

HINDESIGHT WRITERS FEATURED IN


To find out more about the company that provides the tech for this newsletter, visit Substack.com.
THE COMPANY
HindeSight Publishing which runs HindeSight Letters is a unique blend of financial market professionals – investment managers, analysts and a financial editorial team of notable pedigree. The co-founders of Hinde Capital, Ben Davies and Mark Mahaffey, a successful alternative investment management company joined forces to deliver something different in the financial newsletters segment – simply put it’s a reliable newsletter version of a managed fund. Our writers actually run money, not just write about it, so they are the right mix of book smarts and street smarts. Truly a team of individuals that make up a formidable pool of knowledge, wherever the investing landscape shifts to.
THE TEAM

BEN DAVIES
Co-founder & CEO of Hinde Capital

MARK MAHAFFEY
Co-Founder & CFO of Hinde Capital
THE WAY WE THINK
We passionately believe that dividends really, really matter. William Thorndike in his fascinating book 'The Outsiders - Eight Unconventional CEOs and Their Radically Rational Blueprint for Success' examined one of the most important aspects of running a business a CEO must undertake: Capital Allocation. He summarised how a CEO deploys capital in order to best utilise cash flow generated from his or her business operations. Essentially, CEOs have 5 ways of deploying capital:
• Investing in existing operations
• Acquiring other businesses
• Repaying debt
• Repurchasing their own stock (buybacks)
• Paying dividends
Dividend payments are a crucial operation in creating stakeholder wealth. It is this aspect of a business that we are so fixated by - the propensity for a company to produce and continue to grow dividends so that we may accrue wealth over a generation. But as readers will know we can't just grab stocks with the highest yield for fear that this signals some cash flow or even solvency issues for the firm. So it is with this very real threat in mind we explore only well-capitalised FTSE 350 companies.
This letter's purpose is to help inform readers on dividend investing so that they can construct a portfolio of sound UK dividend stocks based on our recommendations.
Our prerequisite is that any stocks selected for this letter must be liquid, well-capitalised with a strong free cash flow and a progressive dividend policy.
Our System
• Every month we will provide a write up of 3 to 4 stocks until we create a portfolio of 25 UK dividend stocks. This will be the HindeSight UK Dividend Portfolio #1
• You will be alerted by subscriber email intra-month when these stocks become a buy. Timing is critical to the strategy, not only buying quality stocks but buying them at the right time
• The entry points will then be recorded in the next monthly in the HindeSight UK Dividend Portfolio section and the stock(s) written up in full
• We will run our winners but tend to rotate every 6 months depending on specific criteria which would elevate cheaper companies into the portfolio relative to stocks that had performed
• The basis for stock and portfolio selection is derived from our quantitative systematic methodology which screens these companies using the Hinde Dividend Value Matrix, (HDVMdl), a proprietary stock-rating system
• In the section on ETPs we will highlight our investment philosophy and the investment process behind our stock selections. This is the b*is of our dynamic risk and money management in our portfolio construction for you. You can also read the stand-alone Hinde Dividend Value Strategy document to see the methodology behind our stock selection.

HOW WE THINK

“We have met the enemy, and he is us.” Walt Kelly
Our key to long-term performance investing is premised on the following:
• Systematic rule-based strategy
• Systematic risk and money management
• Occam’s razor, aka ‘K.I.S.S.’, Keep It Simple Stupid
• Consistency
• Discipline
All our investment ideas are rule-based methodologies driven by systematic and quantitative models.
Hinde Dividend Value Strategy
Hinde Dividend Value Strategy seeks to generate a total return from an actively managed basket of UK dividend paying stocks. The strategy selects 20 highly liquid, mid to- large capitalised stocks on an equally-weighted basis, which offer the highest total return potential. The 50% Hedge version of the strategy would then be subject to a strategic Beta Hedge*, which is designed to cover 50% of the value of the UK stock basket at all times.
The 50% hedge is maintained using UK equity benchmark indices to reduce exposure to overall market volatility, but without reducing overall total returns to the market over the long run. The Hinde Dividend Value Strategy (100% Hedge) would deploy a full beta hedge at all times.
Hinde Dividend Value Matrix ®
The strategy employs a quantitative, systematic methodology, whereby FTSE 100 and FTSE 250 constituent stocks are screened using the Hinde Dividend Value Matrix®, a proprietary stock-rating system. We use the same system to select stocks for any of our strategies, long-only, 50% Hedge or 100% Hedge. The only difference is clearly the extent of the hedge on the exposure to the overall market.
The basic premise of the strategy is to accelerate returns by selecting relatively high yielding stocks that offer the highest potential for capital revaluation. The dynamic rotation of stocks each quarter enables us to sell stocks where the capital revaluation and dividend has been captured, and use this additional capital to invest in more undervalued quality companies. If successful, this cycle of capture and re-investment offers the chance to significantly improve the total return generated by the Dynamic Portfolio.
The basis of the stock selection process is the Hinde Dividend Value Matrix®, which is a derived process that looks at 3 crucial variables:
* Beta is the stock’s sensitivity to market movements, e.g. if a share has a beta of 1.5 its price tends to move by 1.5% for each 1% move in the index
1. Dividend Screen
The top ranking stocks will be those offering a relatively high dividend. A composite of the following criteria comprises the Dividend Rank:
• Relative Dividend Yield
• Dividend Capture
• Payout ratios
The Relative Dividend Yield assesses if a company pays a higher dividend than the Index it derives from (the FTSE 100 or FTSE 250). The Dividend Capture criteria explain how quickly and how much of the dividend is paid at any point in time. The Payout Ratio gives a snapshot of whether a company will be able to maintain and grow its dividend. It helps us to assess how much of a company’s revenue, profit or cash flow is paid out in dividends.
The lower the amount of dividends paid out as a percentage of profits, the healthier future dividend potential will be. History is for once a good guide as to whether companies will continue to pay and grow their dividends. A stock with an excessively high yield relative to its sector or the overall market is invariably showing signs of heightened risk to its dividend sustainability and often the viability of the company itself. The screen incorporates a limit on yield dispersions from the overall market.
The strategy is emphatically not a yield chaser. It is the Performance and Value screens that are used to assess the total return potential of a stock by analysis of how undervalued it is relative to its fundamentals, sector and overall market index.
2. Performance Screen
The top ranking stocks have the poorest relative performance to their index over multiple time horizons.
A composite rank of the following criteria provides the Performance Rank:
• Stock relative performance ranked over multiple time periods
• Average of time periods taken to select rank of stocks
3. Value Screen
The top ranking stocks by key fundamental criteria show stable fundamentals and exhibit upside momentum growth potential. The following are some of the criteria that provide the Value Rank:
• Value - Price to Book (intangible book adjustment), Free Cash Flow metrics
• Quality - Return on Investment and Earnings metrics
• Financial Stability - Debt levels, Coverage and Payout ratios
• Volatility - Stock variance, Dividend variance
• Momentum - Sales Growth, Cash flow metrics
• Liquidity - Minimum market capitalisation relative to index, Shares outstanding
Implementing the Hinde Dividend Value Matrix ®
The FTSE 100 and FTSE 250 stocks are ranked using the Dividend, Performance and Value screens. An equally weighted composite rank is then taken of these 3 ranks, which provides a final ranking from which a selection of 20 stocks is made for the portfolio.
The stocks with the highest ranking are compiled for the FTSE 100 and the FTSE 250. The top 10 from each index are then taken, subject to diversification rules, which entail that normally only 1 stock per sector per index can be invested in. For example, if the top 10 stocks are all mining companies, the selection process would take the first of these and then move on to select the next top stock from another sector. As long as a stock has the highest score in its sector, the fact that it has appeared in the final ranking means it is already eligible for investment. In exceptional circumstances, it may be that more than one stock has to be selected from an individual sector.
EXTERNAL ANALYST SCORE (EAS)
This score is derived from 3 inputs that have been obtained from all the external analysts at leading institutions who are covering the stock:
1. The 12 month target price in relation to current price
2. The number of analysts covering the stock
3. The recommendation analysis, e.g. STRONG SELL, SELL, UNDERPERFORM or HOLD
This score is used to observe the other analysts’ view of the stock and is helpful when understanding the methodology that other analysts use to determine their 12-month target price. We ultimately get a blend of price targets that is based on different valuation metrics.
EAS Score Output:
1. The combined score will vary from 30-70
2. A stock with a lowest score of 30 shows the majority of analysts not only have a full sell/underweight recommendation, but also a low 12-month target price in relation to current price.
3. A stock with the highest score of 70 shows the majority of analysts not only have a full buy/overweight recommendation, but also a high 12-month target price in relation to current price.
Note:
On a standalone basis, the EAS score must be viewed in the following context:
• Equity analysts issue far more positive recommendations than negative
• If all analysts are overwhelmingly bearish or bullish, then this can signal a contrarian position be held, but this is determinate on the where the stock is valued.
However, in conjunction with the HDVM ®, we have found the score to be useful when it is high or momentum is turning higher, as this suggests that the stock offers deep value.
